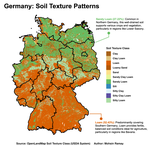
DataWim
DataWim
Home
Skills
Blogs
Contact
Light
Dark
Automatic
ggplot2
From One Sample to Many: Estimating Distributions with Bootstrapping and Permutation
In this blog post, I’ll explain the difference between bootstrapping and permutation using examples in R.
Last updated on Mar 5, 2023
4 min read
Data Science
Art with R
In this blog post, I’ll show how we can create art pieces (target boards) in R using base plotting features and functions.
Last updated on Sep 26, 2022
6 min read
Data Science
Generating different spatial patterns in R and their visualization using ggplot2
In this blog post, I’ll show how we can generate different spatial patterns in R and their visualizations using ggplot2.
Last updated on Sep 17, 2022
6 min read
Data Science
Missing Data Visualization in R using ggplot2
In this blog post, I’ll show how we can visualize missing data in R using
ggplot2
package and remove completely missing features from data set.
Last updated on Sep 5, 2022
13 min read
Data Science
Making Publication Quality Inset Maps in R using ggplot2
In this blog post, I’ll show how we can make publication quality inset maps in R using
ggplot2
package.
Last updated on Aug 25, 2022
13 min read
Data Science
Block Bootstrapping in R using Tidymodels
In this blog post, I’ll show how we can do block bootstrapping in R using
tidyverse
and
tidymodels
packages.
Last updated on Aug 24, 2022
10 min read
Data Science
Plotting different Confidence Intervals around Fitted Line using R and ggplot2
In this blog post, I’ll show that how we can plot different confidence intervals i.e.,
90%
,
95%
or
99%
around the fitted line in R using
ggplot2
library.
Last updated on Jul 6, 2022
5 min read
Data Science
Bootstrapping Regression Coefficients in grouped data using Tidymodels
In this blog post, I’ll show that how we can obtain and visualize bootstrapped estimates of simple linear regression for nested (grouped) data in R using Tidymodels package.
Last updated on Aug 24, 2022
6 min read
Data Science
Bootstrapping Regression Coefficients in grouped data using Tidymodels
In this blog post, I’ll show that how we can obtain and visualize bootstrapped estimates of simple linear regression for nested (grouped) data in R using Tidymodels package.
Last updated on Jan 13, 2022
6 min read
Data Science
Bootstrapping Correlation Coefficients in grouped data using Tidymodels
In this blog post, I ll show that how we can obtain and visualize bootstrapped estimates of simple linear correlation between two variables in nested (grouped) data.
Last updated on Jan 13, 2022
6 min read
Data Science
»
Cite
×