Missing Data Visualization in R using ggplot2
In data science, data cleaning and dealing with missing data is one of the main issues after retrieving a big data set. Data coming from databases or archives never comes in clean and ready-to-analysis format.
Big data always contains features with missing observations. One of the main issues with missing data is deciding whether to eliminate the missing observations or impute them using information from other features.
However, in a few instances, some of the features just come empty, so we don’t need to worry about their imputation because we can simply omit or unselect those columns. But before that, we need to calculate the proportion of missing data in each feature to decide on a threshold to keep features in the data.
In this blog post, I’ll use some basic and dplyr functionality to count missingness in the data and its visualization using the ggplot2 package. After that, I’ll use some available packages that provide built-in functions to visualize the missing data. And then, I’ll show how we can remove the completely missing features from our data sets.
Load libraries
library(tidyverse)
library(gt)
Load data
I’ll use plant pathogen risk data from UK Risk Register for this blog post. The data is publicly available.
# data
data <- read.csv("https://raw.githubusercontent.com/MohsinRamay/sampledata/main/Risk_Register_01_09_2022_10_47_18.csv")
data |>
  glimpse()
## Rows: 1,409
## Columns: 59
## $ Date.Added <chr> …
## $ Status <chr> …
## $ Pest.family <chr> …
## $ Pest.Name <chr> …
## $ Common.name.or.abbreviation <chr> …
## $ Type.of.pest <chr> …
## $ EU.and.EPPO.listing <chr> …
## $ High.levels.of.uncertainty.associated.with.the.risk.scores.for.this.pest <lgl> …
## $ Key.uncertainty <chr> …
## $ Potential.impact.of.key.uncertainty <lgl> …
## $ Climate.uncertainty <chr> …
## $ Potential.impact.of.Climate.uncertainty <lgl> …
## $ Current.Distribution.uncertainty <chr> …
## $ Potential.impact.of.Current.Distribution.uncertainty <lgl> …
## $ UK.Distribution.uncertainty <chr> …
## $ Potential.impact.of.UK.Distribution.uncertainty <lgl> …
## $ Hosts.uncertainty <chr> …
## $ Potential.impact.of.Hosts.uncertainty <lgl> …
## $ Impact.uncertainty <chr> …
## $ Potential.impact.of.Impact.uncertainty <lgl> …
## $ Pathways.uncertainty <chr> …
## $ Potential.impact.of.Pathways.uncertainty <lgl> …
## $ Regulation.uncertainty <chr> …
## $ Potential.impact.of.Regulation.uncertainty <lgl> …
## $ Taxonomy.uncertainty <chr> …
## $ Potential.impact.of.Taxonomy.uncertainty <lgl> …
## $ Other.uncertainty <lgl> …
## $ Potential.impact.of.Other.uncertainty <lgl> …
## $ Major.Hosts <chr> …
## $ UK <chr> …
## $ Europe <chr> …
## $ Global.Distribution <chr> …
## $ Pathways <chr> …
## $ Pathway.Assessed.for.Entry.to.UK <chr> …
## $ Scenario.for.Risk.Register <chr> …
## $ Likelihood <int> …
## $ Impact <int> …
## $ Value.at.Risk <int> …
## $ UK.Relative.Risk.Rating..unmitigated. <int> …
## $ Regulation <chr> …
## $ Surveillance <chr> …
## $ Industry.Scheme <chr> …
## $ Contingency.plan <chr> …
## $ Awareness <chr> …
## $ Research <chr> …
## $ Likelihood.1 <int> …
## $ Impact.1 <int> …
## $ UK.Relative.Risk.Rating..mitigated. <int> …
## $ Regulation.1 <chr> …
## $ Deregulation.or.reduced.regulation <chr> …
## $ Management.by.Industry <chr> …
## $ Targeted.Survey <chr> …
## $ PRA <chr> …
## $ Contingency.Plan <chr> …
## $ Publicity <chr> …
## $ Research.1 <chr> …
## $ Action <chr> …
## $ General.Comments <chr> …
## $ X <chr> …- The data consists of 1409 rows and 59 columns.
- And it’s evident from the data glimpse that some features are missing a considerable amount of data.
- Now, I’ll calculate the percentage of missing data in each column.
Missing data count
miss_data <- data |>
  gather(key, value) |>
  group_by(key) |>
  count(na = is.na(value)) |>
  pivot_wider(names_from = na, values_from = n, values_fill = 0) |>
  mutate(pct_missing = (`TRUE`/sum(`TRUE`, `FALSE`))*100) |>
  ungroup()

miss_data |>
  #sample_n(10) |>
gt()| key | FALSE | TRUE | pct_missing |
|---|---|---|---|
| Action | 1409 | 0 | 0.00000 |
| Awareness | 1409 | 0 | 0.00000 |
| Climate.uncertainty | 1409 | 0 | 0.00000 |
| Common.name.or.abbreviation | 1409 | 0 | 0.00000 |
| Contingency.plan | 1409 | 0 | 0.00000 |
| Contingency.Plan | 1409 | 0 | 0.00000 |
| Current.Distribution.uncertainty | 1409 | 0 | 0.00000 |
| Date.Added | 1409 | 0 | 0.00000 |
| Deregulation.or.reduced.regulation | 1409 | 0 | 0.00000 |
| EU.and.EPPO.listing | 1409 | 0 | 0.00000 |
| Europe | 1409 | 0 | 0.00000 |
| General.Comments | 1409 | 0 | 0.00000 |
| Global.Distribution | 1409 | 0 | 0.00000 |
| High.levels.of.uncertainty.associated.with.the.risk.scores.for.this.pest | 0 | 1409 | 100.00000 |
| Hosts.uncertainty | 1409 | 0 | 0.00000 |
| Impact | 1137 | 272 | 19.30447 |
| Impact.1 | 1137 | 272 | 19.30447 |
| Impact.uncertainty | 1409 | 0 | 0.00000 |
| Industry.Scheme | 1409 | 0 | 0.00000 |
| Key.uncertainty | 1409 | 0 | 0.00000 |
| Likelihood | 1138 | 271 | 19.23350 |
| Likelihood.1 | 1138 | 271 | 19.23350 |
| Major.Hosts | 1409 | 0 | 0.00000 |
| Management.by.Industry | 1409 | 0 | 0.00000 |
| Other.uncertainty | 0 | 1409 | 100.00000 |
| Pathway.Assessed.for.Entry.to.UK | 1409 | 0 | 0.00000 |
| Pathways | 1409 | 0 | 0.00000 |
| Pathways.uncertainty | 1409 | 0 | 0.00000 |
| Pest.family | 1409 | 0 | 0.00000 |
| Pest.Name | 1409 | 0 | 0.00000 |
| Potential.impact.of.Climate.uncertainty | 0 | 1409 | 100.00000 |
| Potential.impact.of.Current.Distribution.uncertainty | 0 | 1409 | 100.00000 |
| Potential.impact.of.Hosts.uncertainty | 0 | 1409 | 100.00000 |
| Potential.impact.of.Impact.uncertainty | 0 | 1409 | 100.00000 |
| Potential.impact.of.key.uncertainty | 0 | 1409 | 100.00000 |
| Potential.impact.of.Other.uncertainty | 0 | 1409 | 100.00000 |
| Potential.impact.of.Pathways.uncertainty | 0 | 1409 | 100.00000 |
| Potential.impact.of.Regulation.uncertainty | 0 | 1409 | 100.00000 |
| Potential.impact.of.Taxonomy.uncertainty | 0 | 1409 | 100.00000 |
| Potential.impact.of.UK.Distribution.uncertainty | 0 | 1409 | 100.00000 |
| PRA | 1409 | 0 | 0.00000 |
| Publicity | 1409 | 0 | 0.00000 |
| Regulation | 1409 | 0 | 0.00000 |
| Regulation.1 | 1409 | 0 | 0.00000 |
| Regulation.uncertainty | 1409 | 0 | 0.00000 |
| Research | 1409 | 0 | 0.00000 |
| Research.1 | 1409 | 0 | 0.00000 |
| Scenario.for.Risk.Register | 1409 | 0 | 0.00000 |
| Status | 1409 | 0 | 0.00000 |
| Surveillance | 1409 | 0 | 0.00000 |
| Targeted.Survey | 1409 | 0 | 0.00000 |
| Taxonomy.uncertainty | 1409 | 0 | 0.00000 |
| Type.of.pest | 1409 | 0 | 0.00000 |
| UK | 1409 | 0 | 0.00000 |
| UK.Distribution.uncertainty | 1409 | 0 | 0.00000 |
| UK.Relative.Risk.Rating..mitigated. | 1140 | 269 | 19.09155 |
| UK.Relative.Risk.Rating..unmitigated. | 1139 | 270 | 19.16253 |
| Value.at.Risk | 1137 | 272 | 19.30447 |
| X | 1409 | 0 | 0.00000 |
- Now, I’ll visualize this missing data proportion using the bar chart.
- I’ll reorder the bars based on missingness so we can easily see the columns missing the maximum amount of data.
Missing data visualization
miss_data |>
  mutate(Present = 100 - pct_missing) |>
  gather(Key, value, 4:5) |>
  mutate(Key = recode(Key, pct_missing = "Missing")) |>
  ggplot(aes(x = reorder(key, `TRUE`), y = value, fill = Key)) +
  geom_col(alpha = 0.85) +
  scale_fill_manual(name = "",
                          values = c('tomato3', 'steelblue'),
                          labels = c("Missing", "Present")) +
  coord_flip() +
  labs(x = NULL, y = "Missing (%)")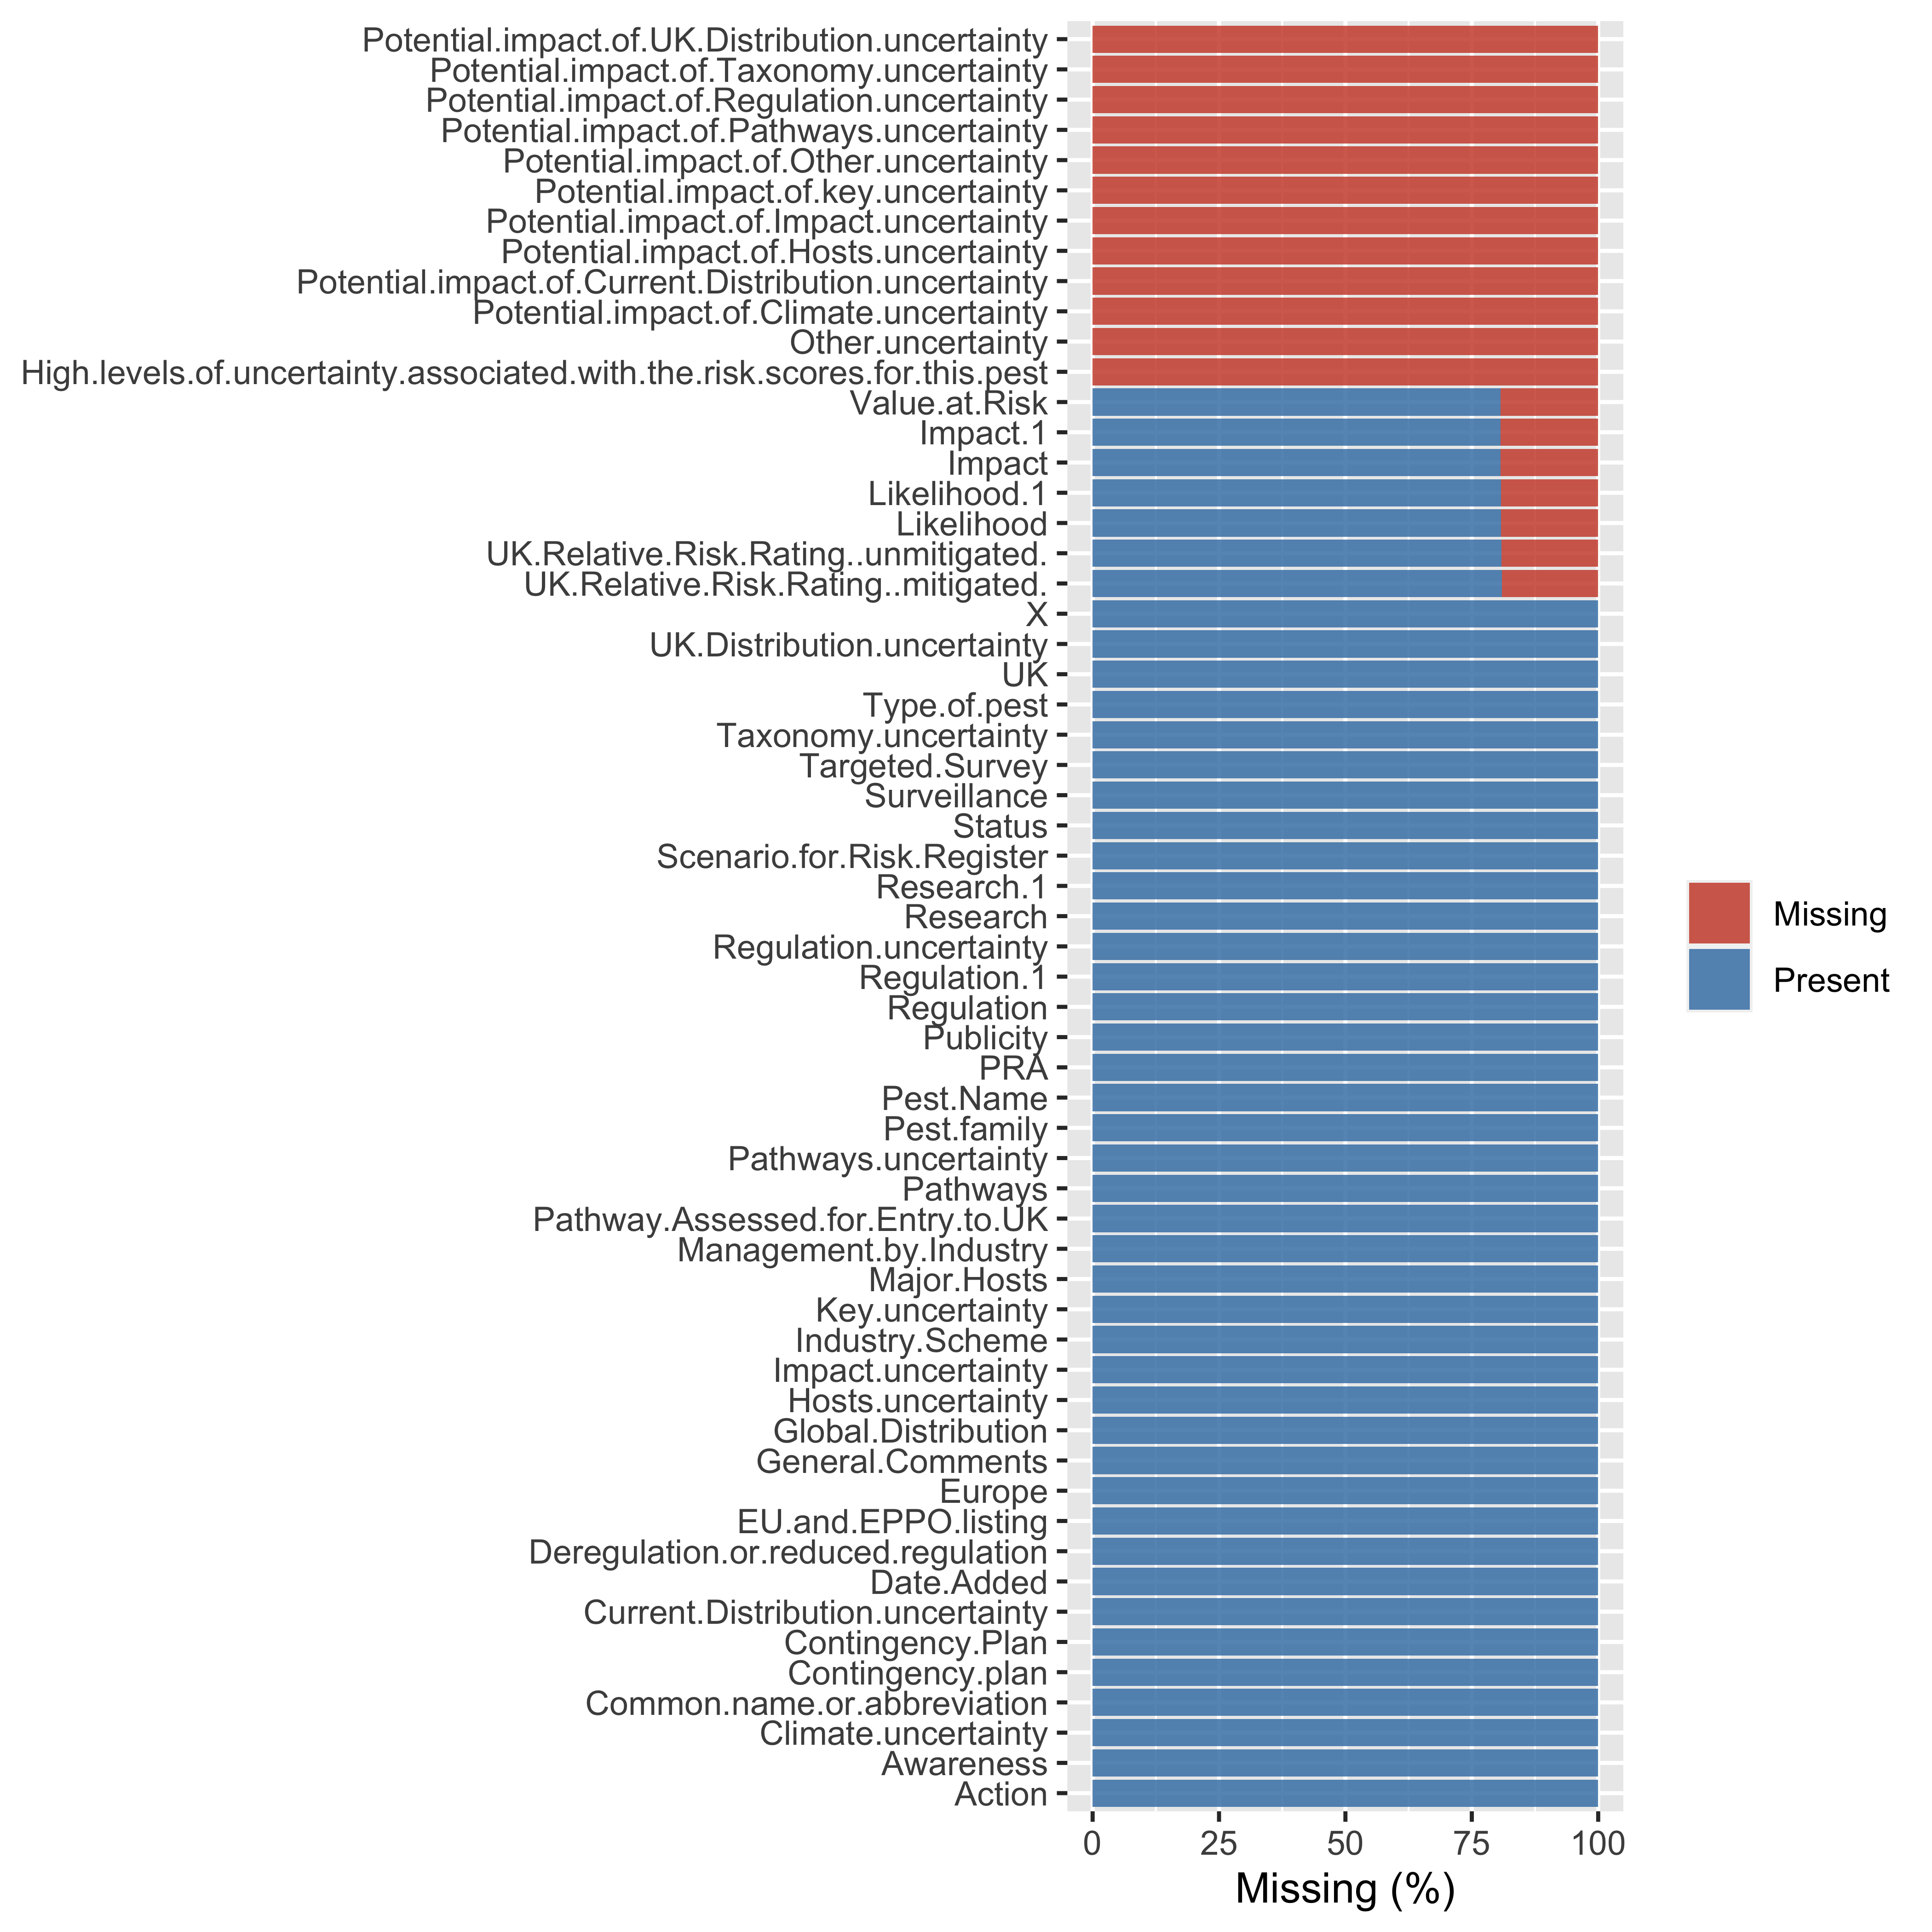
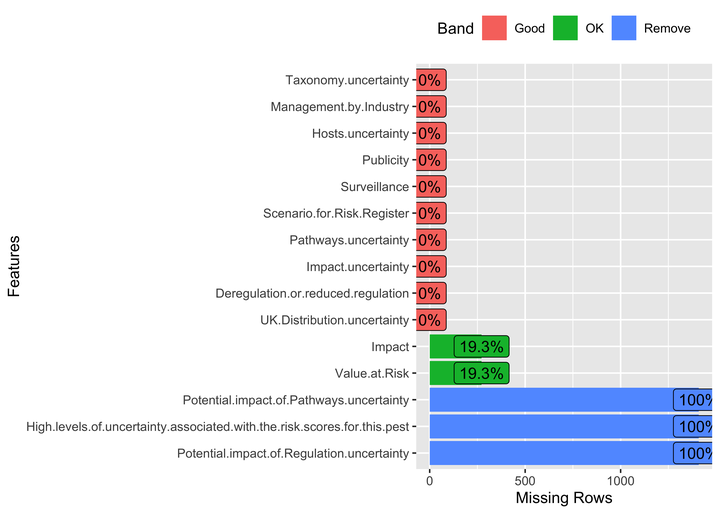
So, we can see that some of the columns are completely missing data, and we can remove them before moving towards further visualizations and data analysis. But before that, I’ll share another package that provides an already built function that can help us quickly visualize the amount of missing data in columns. And that function is plot_missing() from the DataExplorer. This function uses built-in criteria to create a missing profile for each column, i.e., Good, OK, Bad and Remove. The default criteria are:
- “Good” = 0.05
- “OK” = 0.4
- “Bad” = 0.8
- “Remove” = 1
plot_missing function from DataExplorer package
library(DataExplorer)
miss_plot <- plot_missing(data)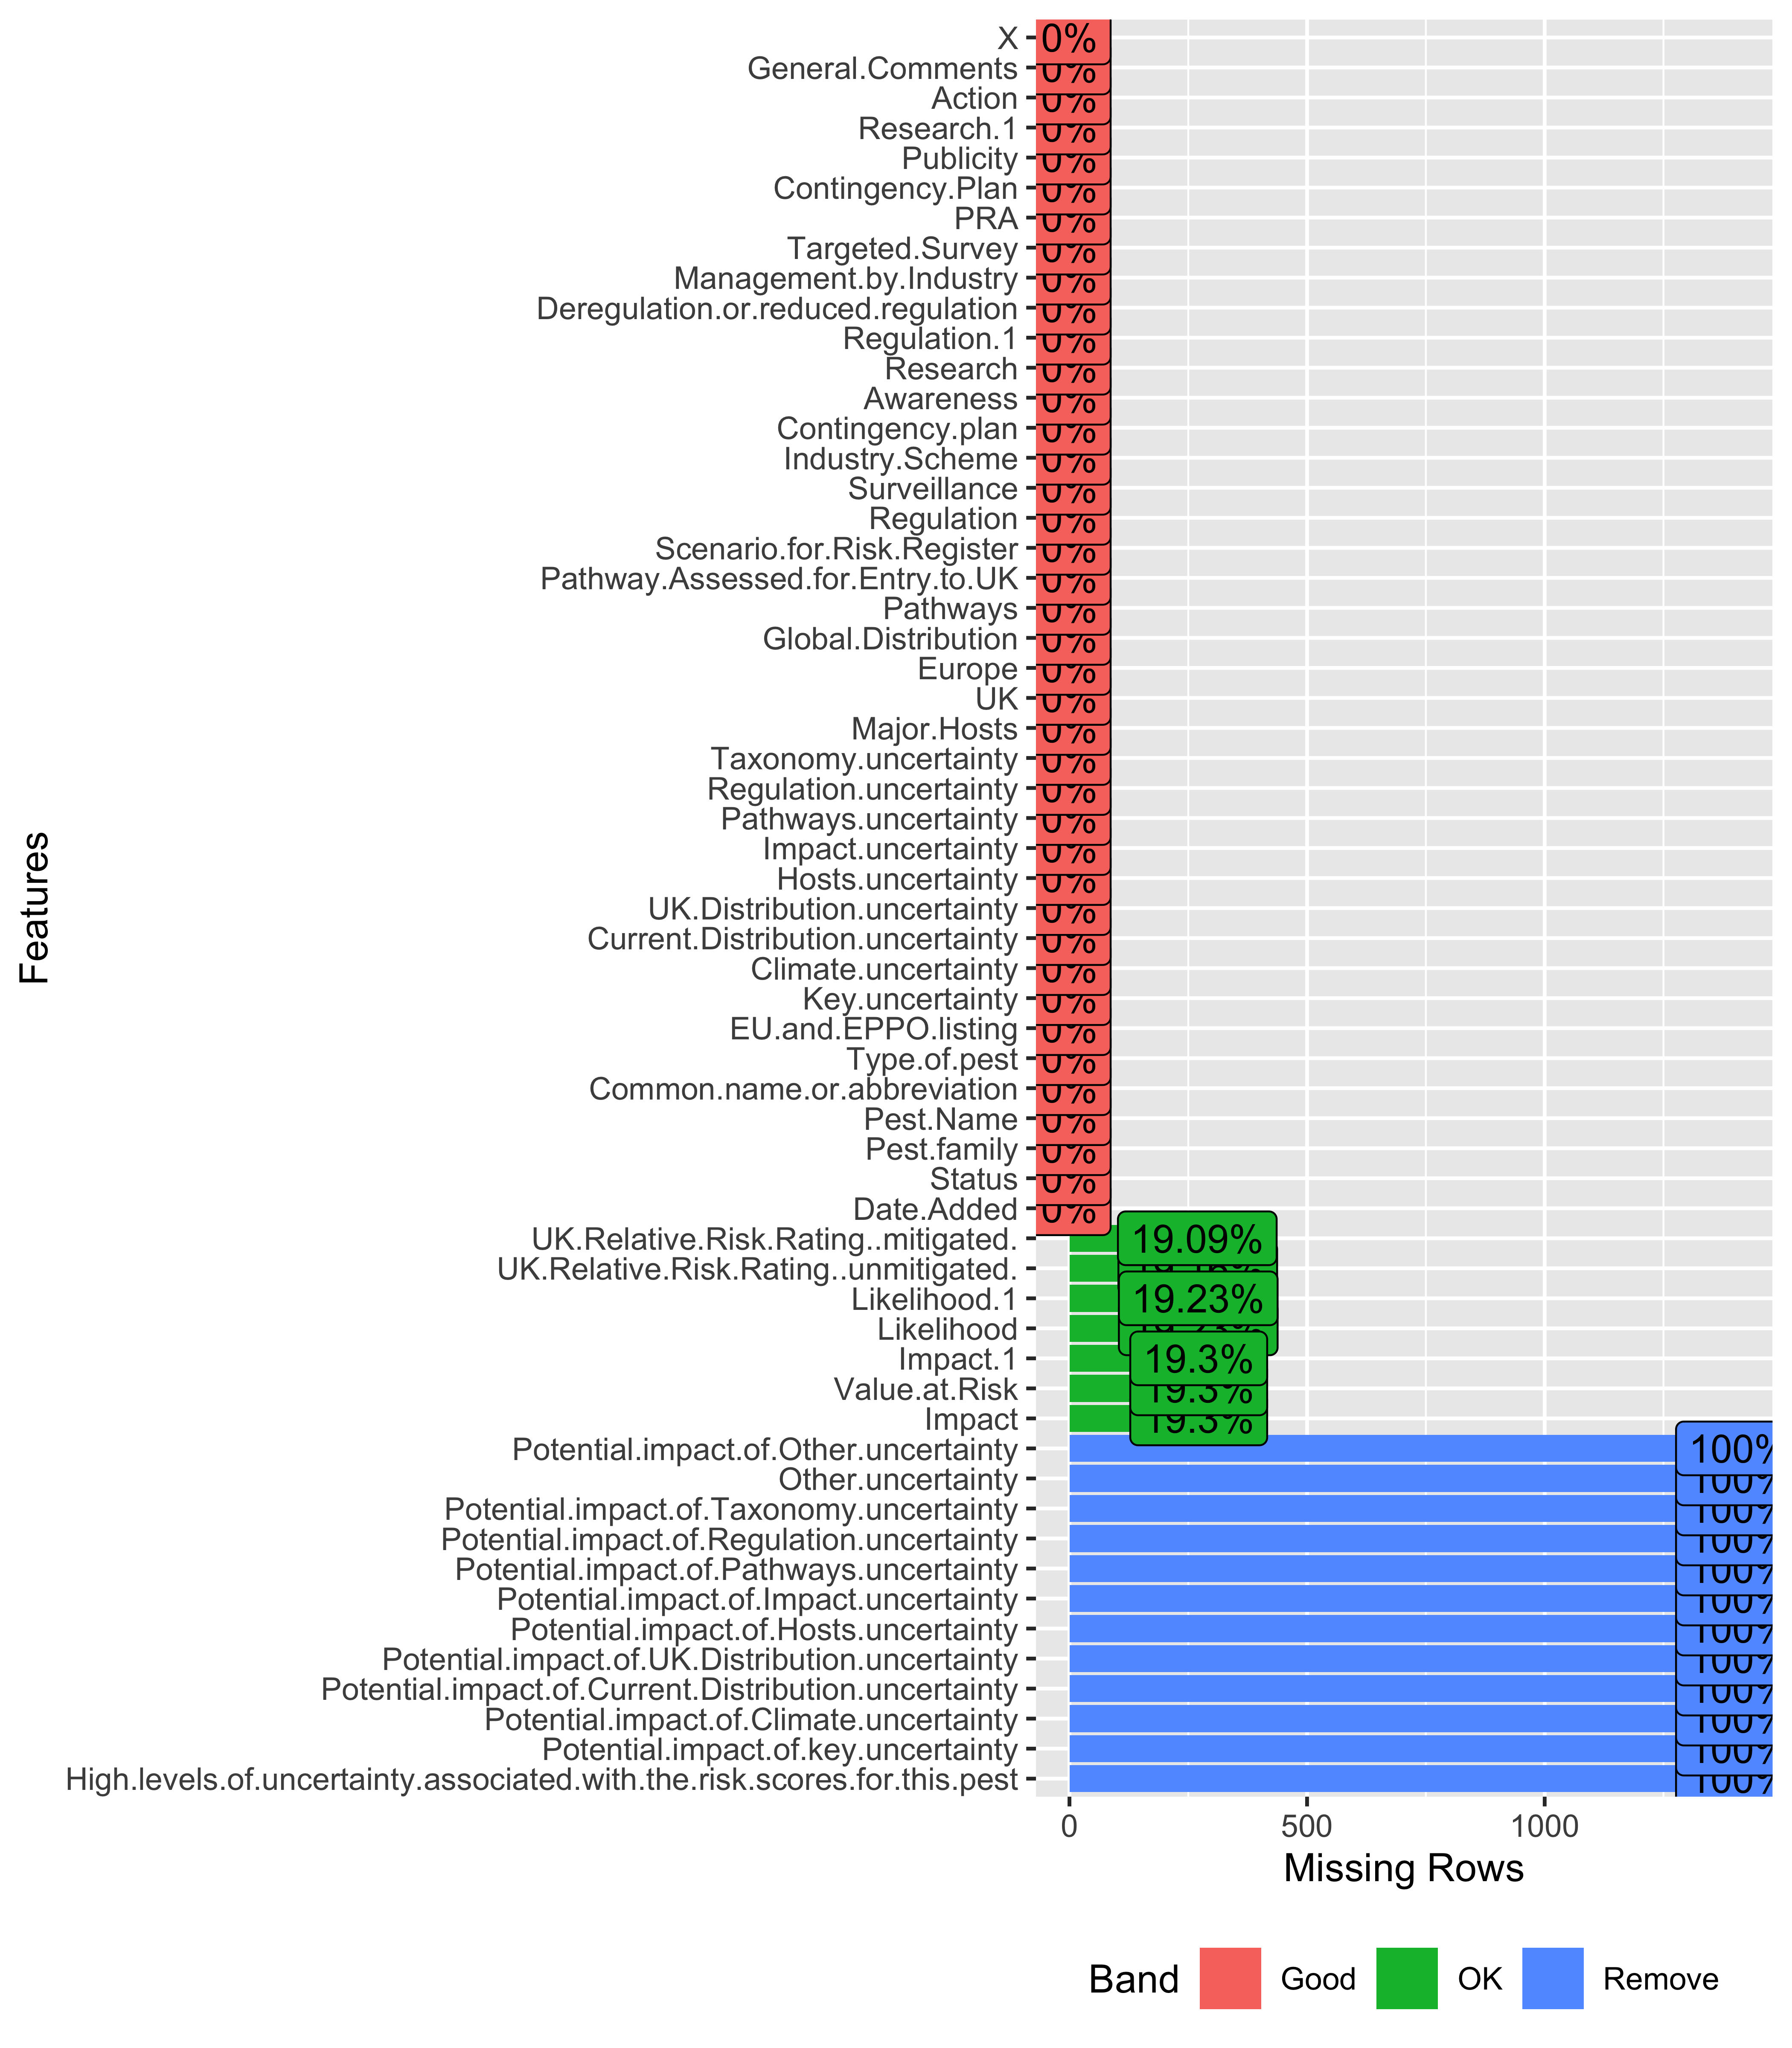
This is very quick and doesn’t need any extra line of code to compute missingness in data. Also, we can edit or update the profiling criteria as per our use.
Removing completely missing data
Like plotting missing data, there are some accessible functions that can help us omitting the columns missing data completely. However, I’ll first show how we can write our own code to do this job.
- At first, I’ll extract the data from the
plot_missing()function object, i.e., miss_plot, created in the last step.
miss_plot$dataWe can see that this data object consists of four columns and 59 rows. Rows are essentially the column names from our original dataset. Therefore, we can use the pct_missing column to filter the unwanted columns.
miss_plot$data |>
  filter(pct_missing == 1)
## feature
## 1: High.levels.of.uncertainty.associated.with.the.risk.scores.for.this.pest
## 2: Potential.impact.of.key.uncertainty
## 3: Potential.impact.of.Climate.uncertainty
## 4: Potential.impact.of.Current.Distribution.uncertainty
## 5: Potential.impact.of.UK.Distribution.uncertainty
## 6: Potential.impact.of.Hosts.uncertainty
## 7: Potential.impact.of.Impact.uncertainty
## 8: Potential.impact.of.Pathways.uncertainty
## 9: Potential.impact.of.Regulation.uncertainty
## 10: Potential.impact.of.Taxonomy.uncertainty
## 11: Other.uncertainty
## 12: Potential.impact.of.Other.uncertainty
## num_missing pct_missing Band
## 1: 1409 1 Remove
## 2: 1409 1 Remove
## 3: 1409 1 Remove
## 4: 1409 1 Remove
## 5: 1409 1 Remove
## 6: 1409 1 Remove
## 7: 1409 1 Remove
## 8: 1409 1 Remove
## 9: 1409 1 Remove
## 10: 1409 1 Remove
## 11: 1409 1 Remove
## 12: 1409 1 RemoveThen we can pull the names of the completely missing columns and save them as a new object for further processing.
miss_cols <- miss_plot$data |>
  filter(pct_missing == 1) |>
  pull(feature)

miss_cols
## [1] High.levels.of.uncertainty.associated.with.the.risk.scores.for.this.pest
## [2] Potential.impact.of.key.uncertainty
## [3] Potential.impact.of.Climate.uncertainty
## [4] Potential.impact.of.Current.Distribution.uncertainty
## [5] Potential.impact.of.UK.Distribution.uncertainty
## [6] Potential.impact.of.Hosts.uncertainty
## [7] Potential.impact.of.Impact.uncertainty
## [8] Potential.impact.of.Pathways.uncertainty
## [9] Potential.impact.of.Regulation.uncertainty
## [10] Potential.impact.of.Taxonomy.uncertainty
## [11] Other.uncertainty
## [12] Potential.impact.of.Other.uncertainty
## 59 Levels: High.levels.of.uncertainty.associated.with.the.risk.scores.for.this.pest ...Now we can use the select function to remove the unwanted columns.
clean_data <- data |>
  select(-miss_cols)

# clean data
glimpse(clean_data)
## Rows: 1,409
## Columns: 47
## $ Date.Added <chr> "17/12/2019", "04/03/2020", "08/…
## $ Status <chr> "Live - Archived", "Live - Archi…
## $ Pest.family <chr> "Rhizobiaceae", "Rhizobiaceae", …
## $ Pest.Name <chr> "'Candidatus Liberibacter africa…
## $ Common.name.or.abbreviation <chr> "Greening of citrus", "dieback (…
## $ Type.of.pest <chr> "Bacterium", "Bacterium", "Bacte…
## $ EU.and.EPPO.listing <chr> "Regulated quarantine pest (Nort…
## $ Key.uncertainty <chr> "", "Rapid addition in a worksho…
## $ Climate.uncertainty <chr> "", "", "", "", "", "", "", "", …
## $ Current.Distribution.uncertainty <chr> "", "", "", "", "", "", "", "", …
## $ UK.Distribution.uncertainty <chr> "", "", "", "", "", "", "", "", …
## $ Hosts.uncertainty <chr> "", "", "", "", "", "", "", "", …
## $ Impact.uncertainty <chr> "", "", "", "", "", "", "", "", …
## $ Pathways.uncertainty <chr> "", "", "", "", "", "", "", "", …
## $ Regulation.uncertainty <chr> "", "", "", "", "", "", "", "", …
## $ Taxonomy.uncertainty <chr> "", "", "", "", "", "", "", "", …
## $ Major.Hosts <chr> "Aegle; Afraegle; Calodendrum; C…
## $ UK <chr> "Absent", "Absent", "Absent", "U…
## $ Europe <chr> "", "", "", "", "", "Belgium; Cz…
## $ Global.Distribution <chr> "Burundi; Central African Republ…
## $ Pathways <chr> "", "Cut flowers or branches; Fr…
## $ Pathway.Assessed.for.Entry.to.UK <chr> "", "Plants for planting (except…
## $ Scenario.for.Risk.Register <chr> "Pest is introduced", "Pest is i…
## $ Likelihood <int> NA, NA, 0, NA, NA, 3, 4, 4, 3, 0…
## $ Impact <int> NA, NA, 0, NA, NA, 2, 3, 3, 4, 0…
## $ Value.at.Risk <int> NA, NA, 0, NA, NA, 4, 5, 5, 5, 0…
## $ UK.Relative.Risk.Rating..unmitigated. <int> 1, 1, 1, NA, NA, 24, 60, 60, 60,…
## $ Regulation <chr> "Regulated quarantine pest (NI o…
## $ Surveillance <chr> "", "", "", "", "", "", "", "", …
## $ Industry.Scheme <chr> "", "", "", "", "", "", "", "", …
## $ Contingency.plan <chr> "", "", "", "", "", "", "", "", …
## $ Awareness <chr> "", "", "", "", "", "", "", "", …
## $ Research <chr> "", "", "", "", "", "", "", "", …
## $ Likelihood.1 <int> NA, NA, 0, NA, NA, 3, 2, 2, 2, 0…
## $ Impact.1 <int> NA, NA, 0, NA, NA, 2, 3, 3, 4, 0…
## $ UK.Relative.Risk.Rating..mitigated. <int> 1, 1, 1, NA, NA, 24, 30, 30, 40,…
## $ Regulation.1 <chr> "", "", "", "", "", "", "", "", …
## $ Deregulation.or.reduced.regulation <chr> "", "", "", "", "", "", "", "", …
## $ Management.by.Industry <chr> "", "", "", "", "", "", "", "", …
## $ Targeted.Survey <chr> "", "", "", "", "", "", "Y", "",…
## $ PRA <chr> "", "", "", "", "", "", "", "", …
## $ Contingency.Plan <chr> "", "", "", "", "", "", "", "", …
## $ Publicity <chr> "", "", "", "", "", "", "", "", …
## $ Research.1 <chr> "", "", "", "", "", "", "Y", "",…
## $ Action <chr> "No statutory action in Great Br…
## $ General.Comments <chr> "Host not widely grown in the UK…
## $ X <chr> "", "", "", "", "", "", "", "", …# missingness in clean data
plot_missing(clean_data)
- We can see that columns with 100% missing values have been removed.
Now, I’ll share other functions we can use to remove missing features.
remove_empty function from janitor package
library(janitor)
remove_empty(data) |>
  plot_missing()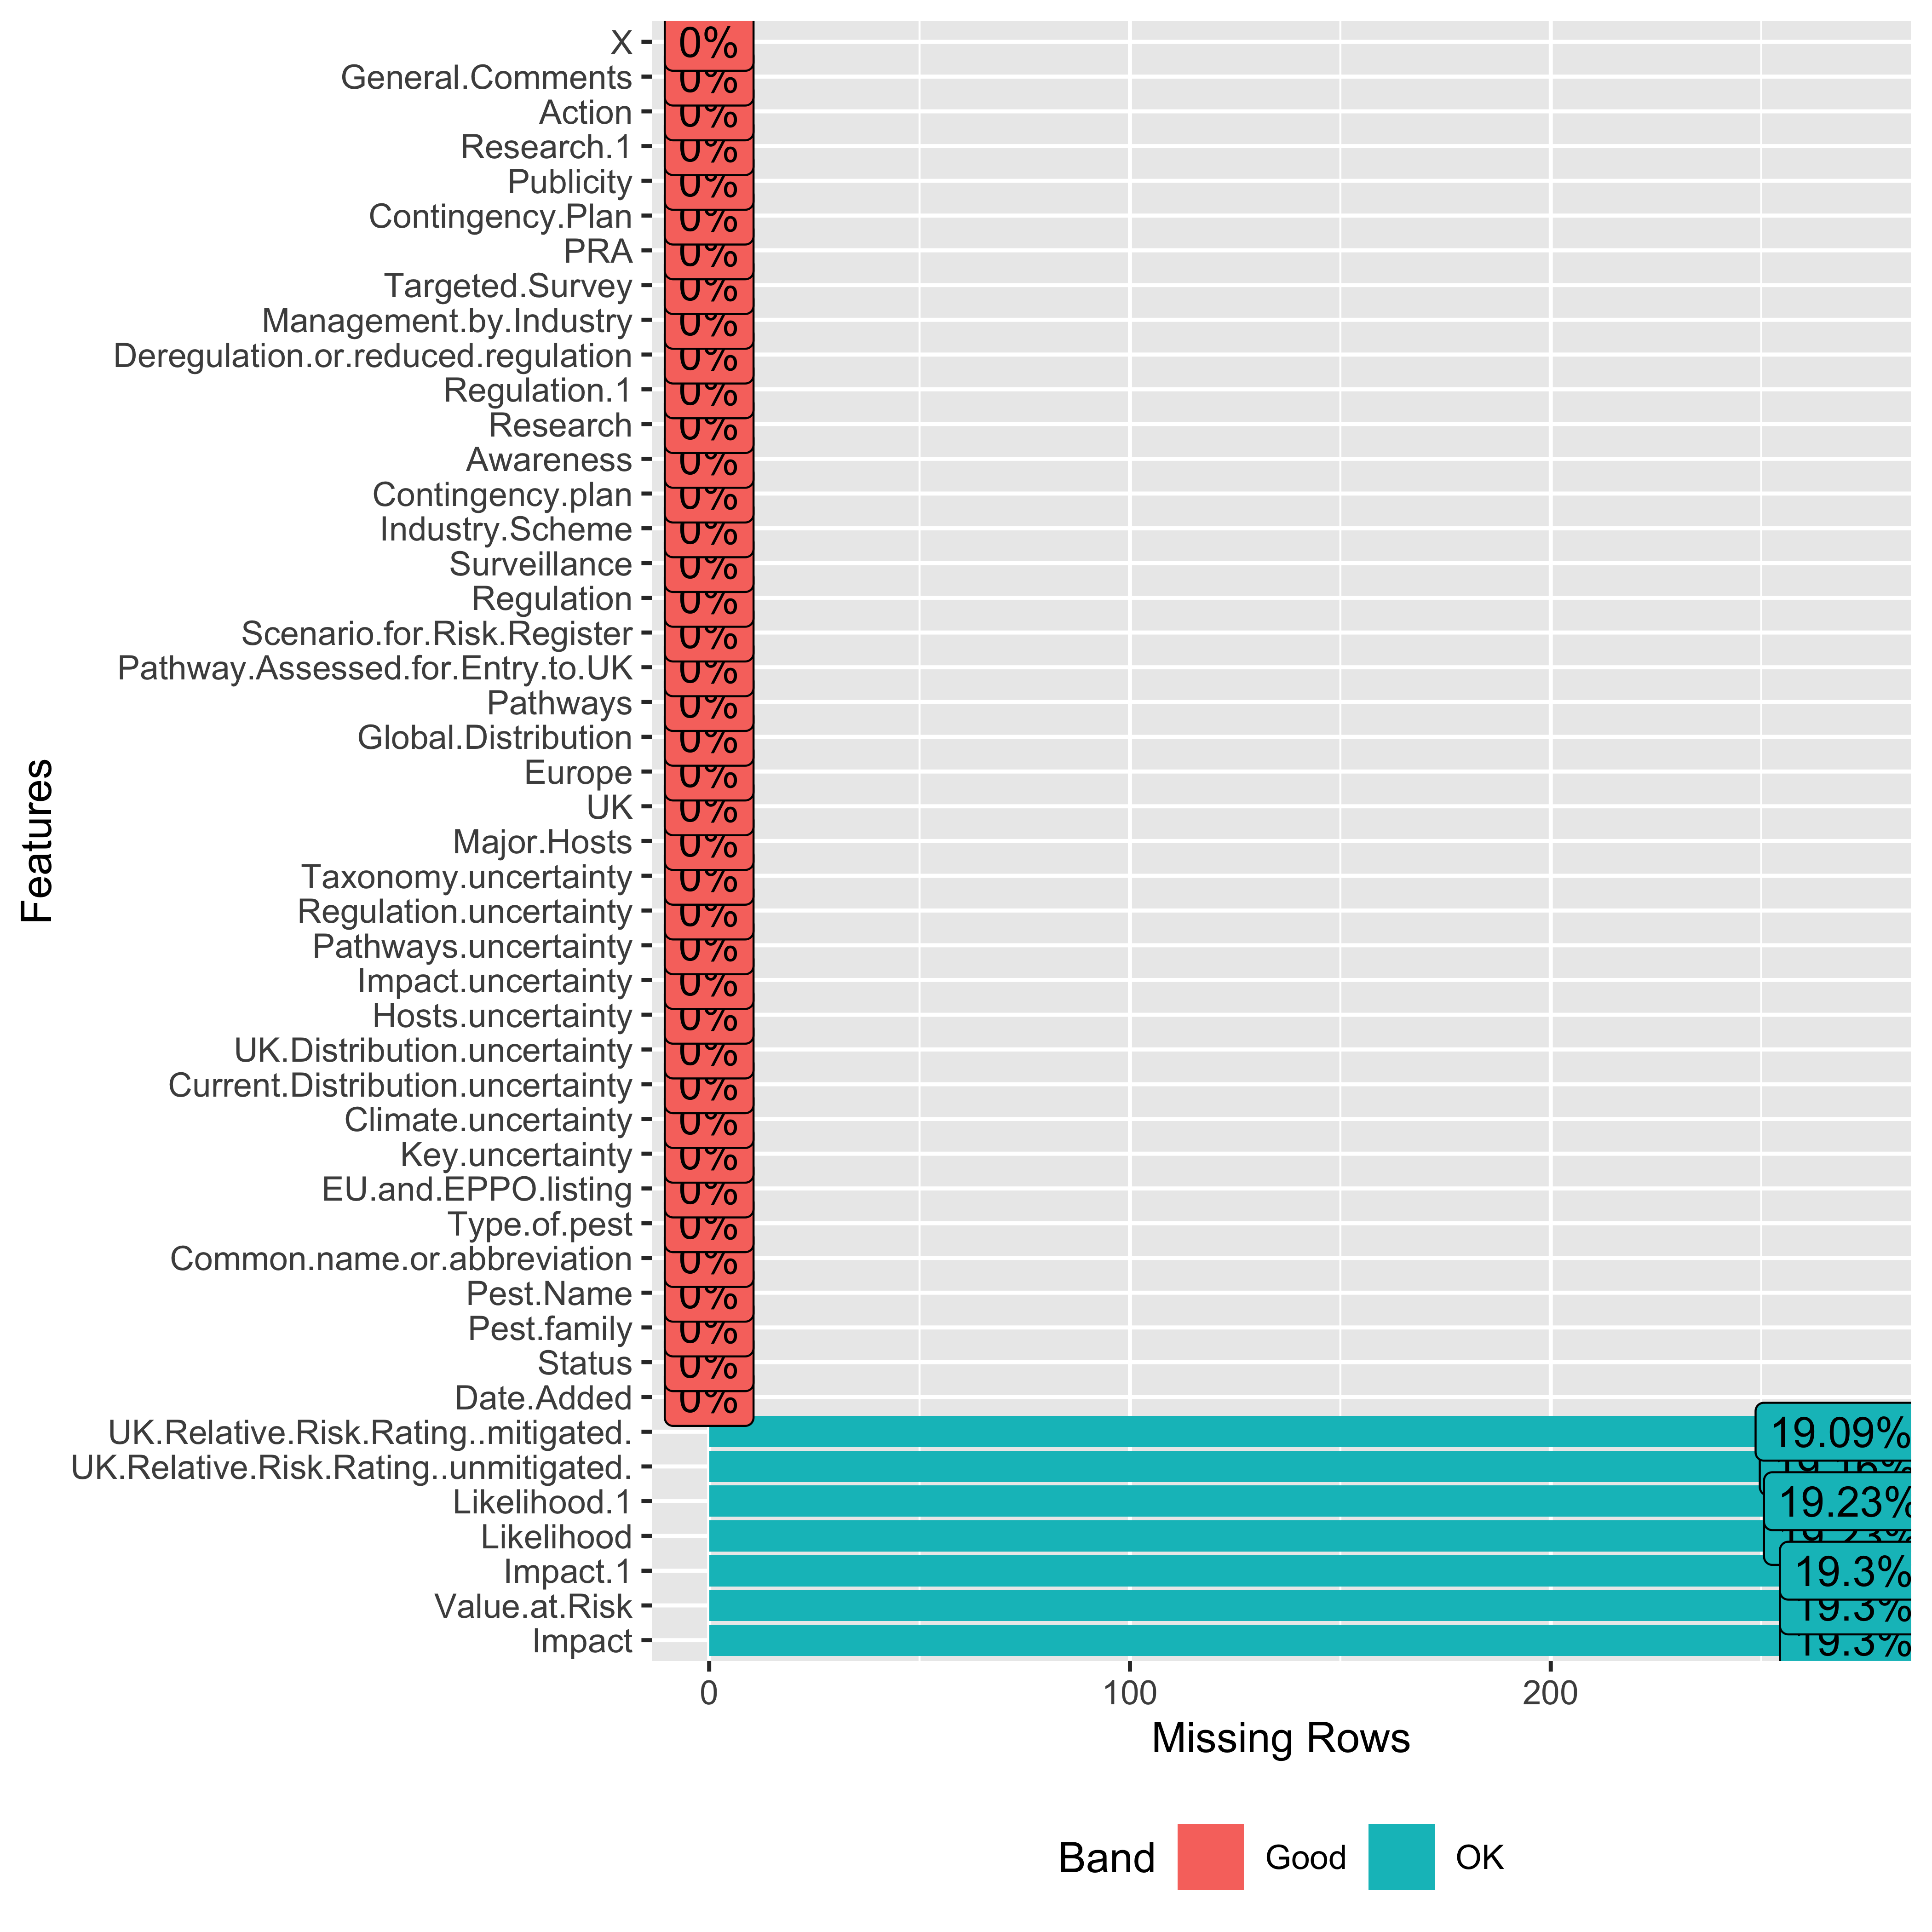
where function
data |>
  select(
    where(
      ~sum(!is.na(.x)) > 0
    )
  ) |>
  plot_missing()
data |>
  select(
    where(
      ~!all(is.na(.x))
    )
  ) |>
  plot_missing()
Base functions
data[colSums(!is.na(data)) > 0] |>
  plot_missing()
That’s it!
Feel free to reach me out if you got any questions.
Muhammad Mohsin Raza
Data Scientist
My research interests include disease modeling in space and time, climate change, GIS and Remote Sensing and Data Science in Agriculture.