Making Merry Christmas Tree in R

In this blog post, I ll show that how we can generate data for christmas tree and plot it using R.
Load libraries
library(tidyverse)
library(mlbench)
library(viridis)
Generating data for the tree
At first, I’ll generate data for the canopy (triangular format) and stem of the tree.
Canopy
There are many ways to generate data but it can be tricky to generate data based on a specific shape. I found an easy way to generate data for basic shapes formats i.e., square, circle or triangle to name a few. R package mlbench provides functions to to generate datasets of various shapes. I used mlbench.shapes function that generates data on the pattern of a Gaussian, square, triangle and wave in 2 dimensions.
set.seed(12345)
data <- mlbench.shapes(n=100000)
plot(data)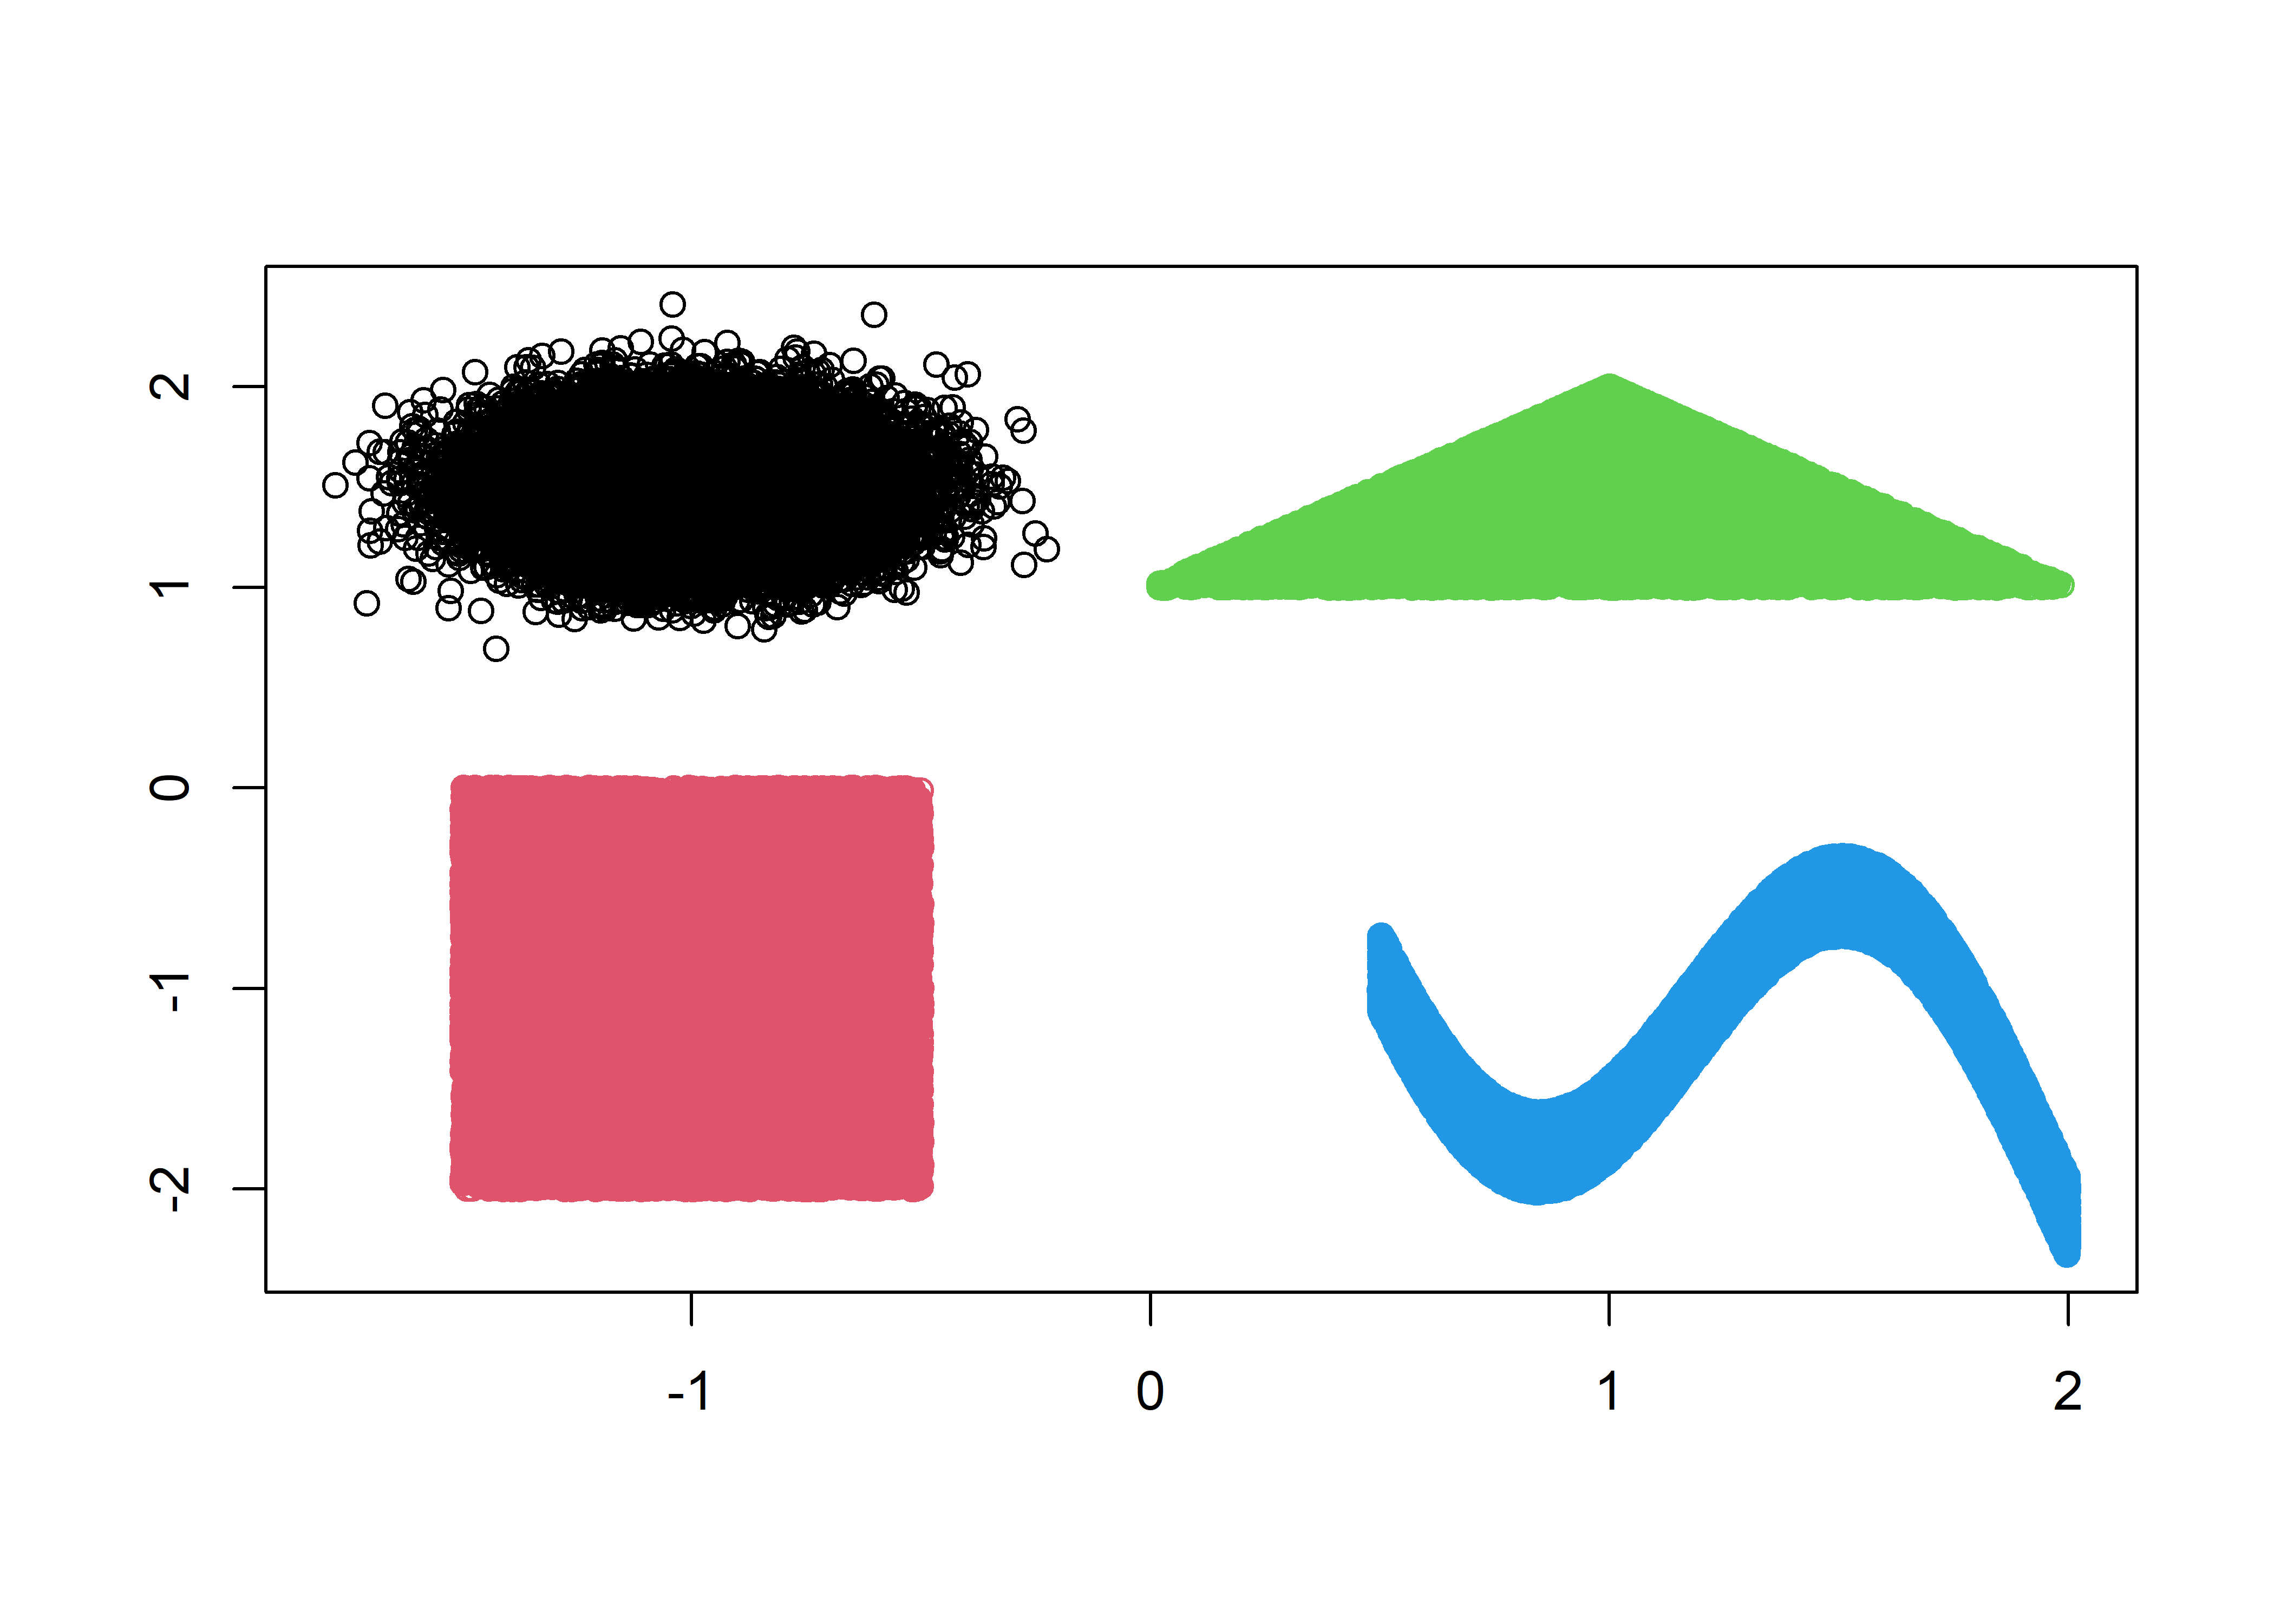
# Extract trianglular data = class 3
canopy <- data %>%
  as.data.frame() %>%
  filter(classes == "3")

# plot canopy data
plot(canopy$x.x4, canopy$x.V2, col = "darkgreen", xlab = "x", ylab = "y")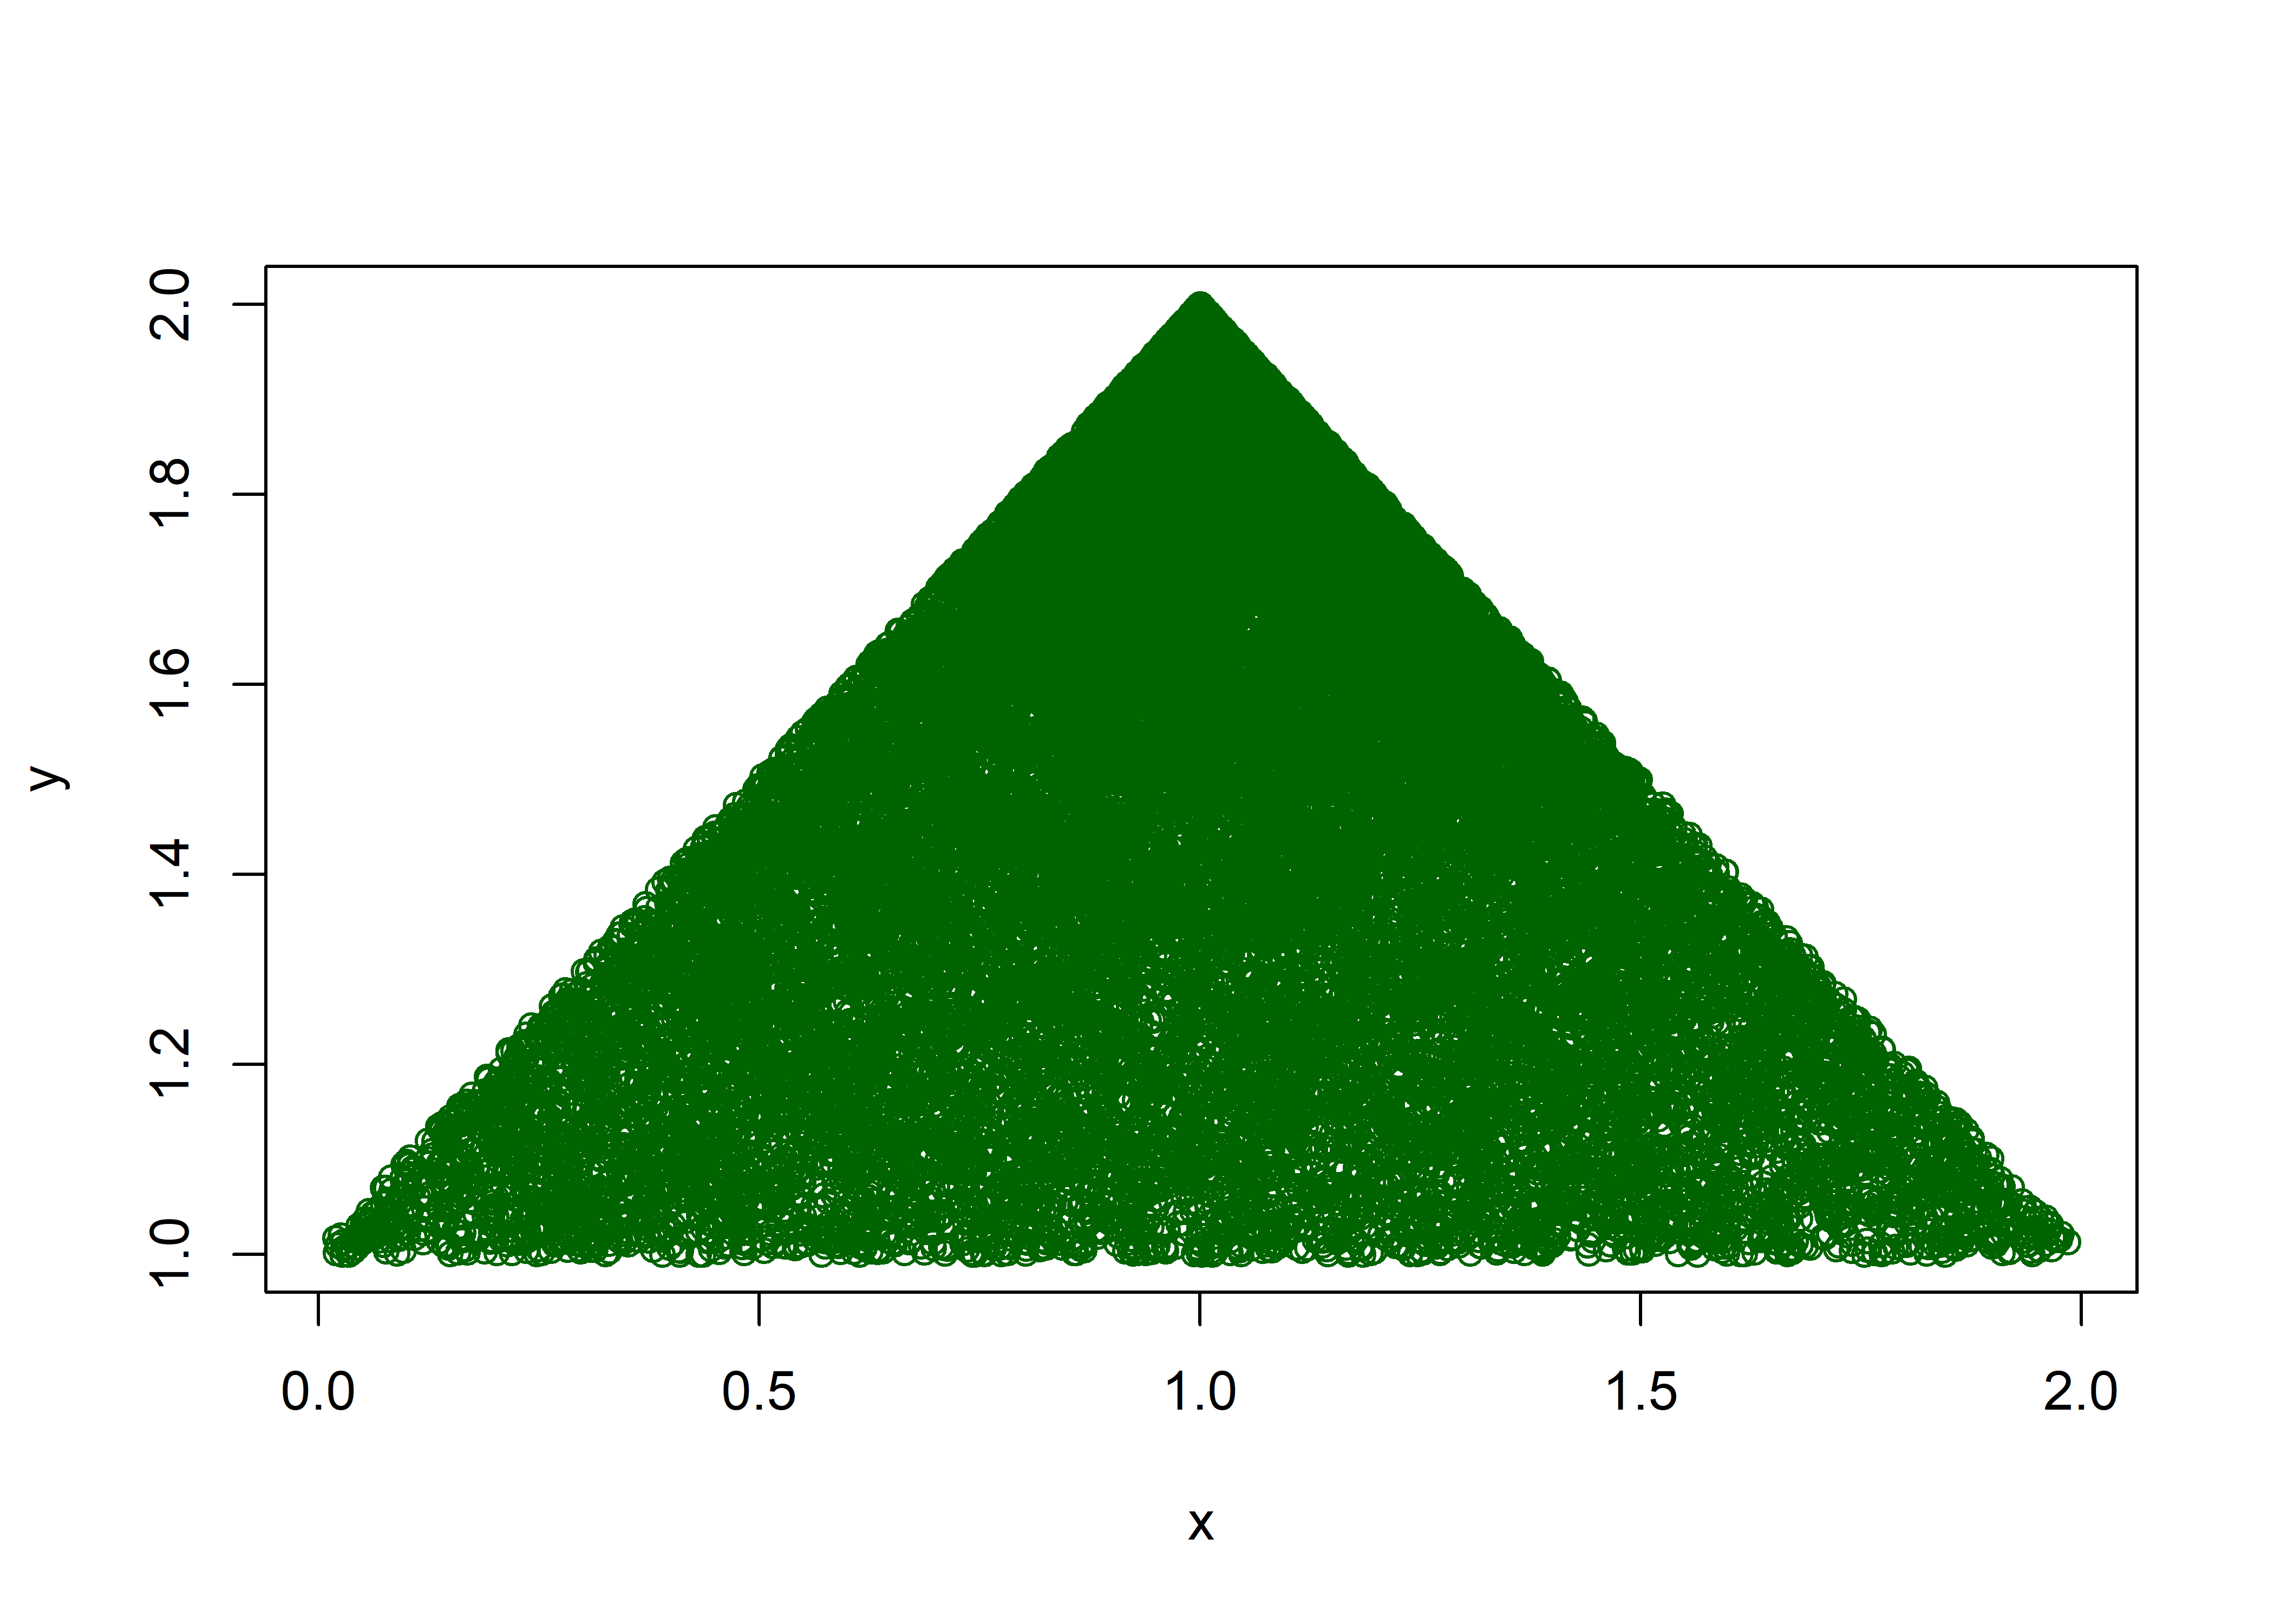
Tree stem
For tree stem, I’ll generate a small rectangular data frame that we can add under canopy.
y <- c(0.8, 1, 1, 0.8)
x <- c(00.8, 00.8, 1.2, 1.2)

# bind columns as a data frame
trunk = as.data.frame(cbind(x, y))

# plot data
plot(x, y)
polygon(x, y, col = 'brown')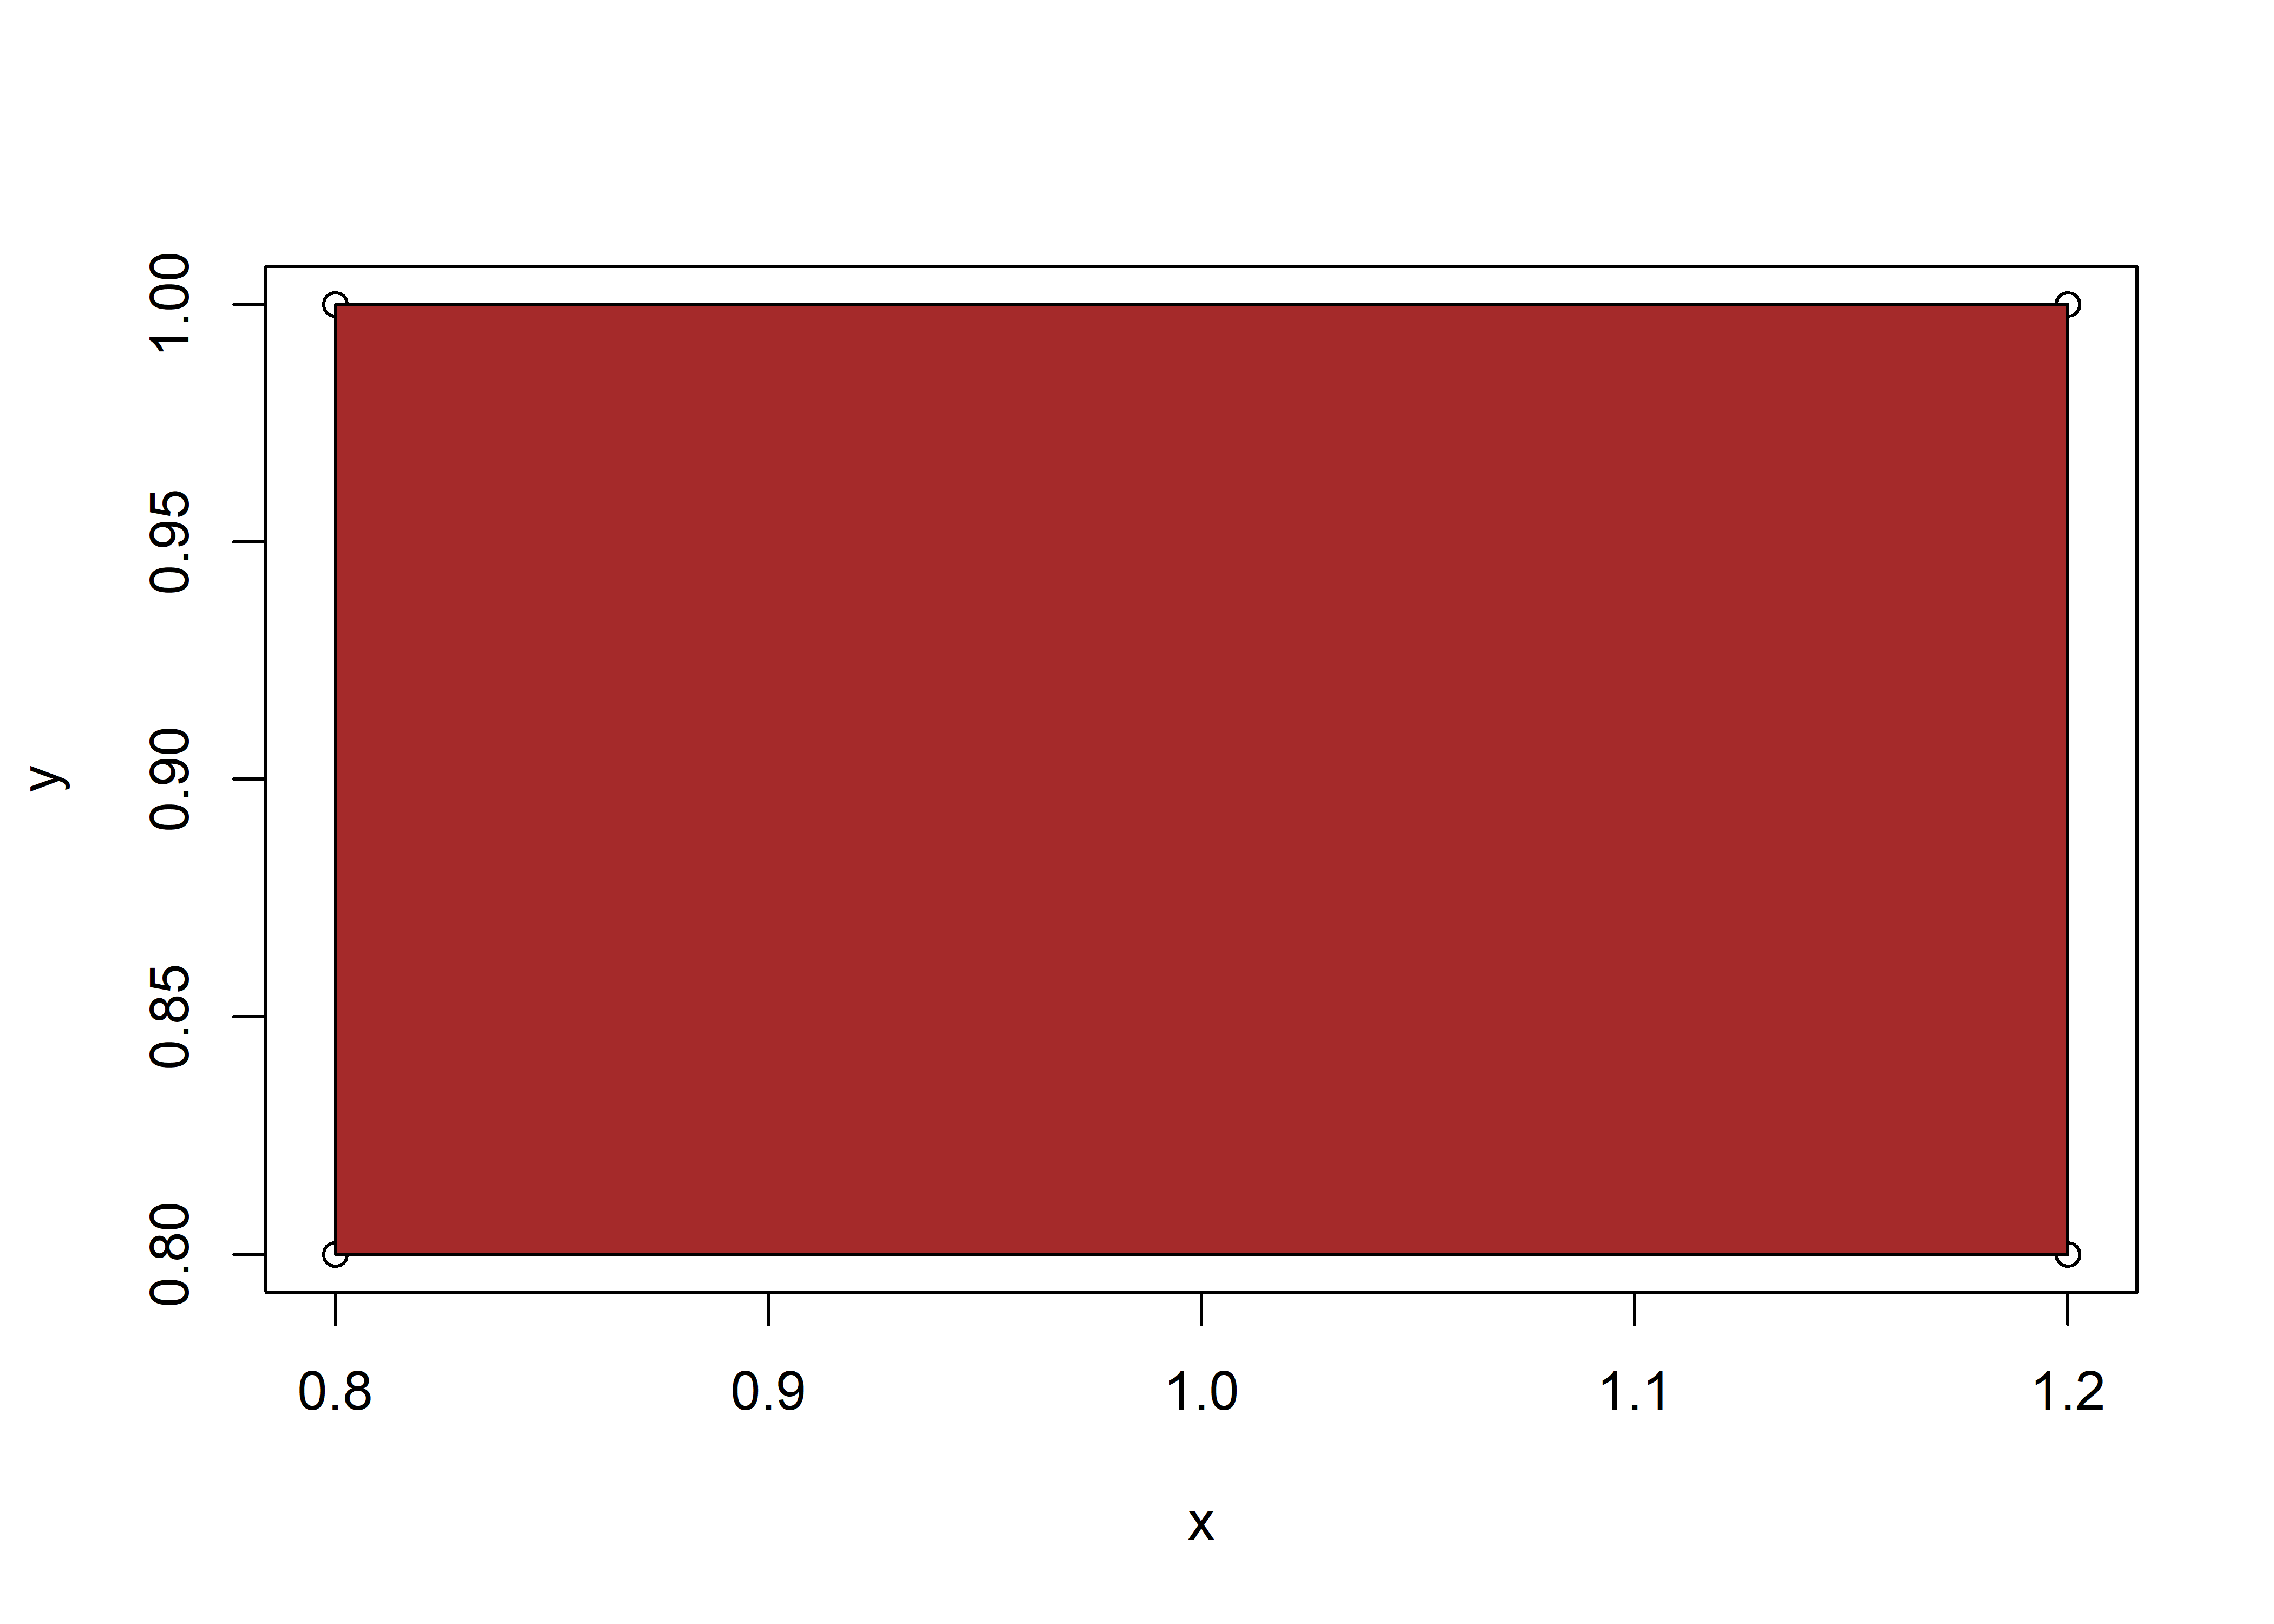
Christmas tree
Now I’ll plot the tree using different plotting functions in ggplot2 package of R.
Points
p1 <- ggplot() +
  geom_polygon(aes(x = x, y = y), data = trunk, fill = "brown") +
  geom_point(aes(x = x.x4, y = x.V2), shape = 3, data = canopy, colour = "darkgreen") +
  theme_void()

p1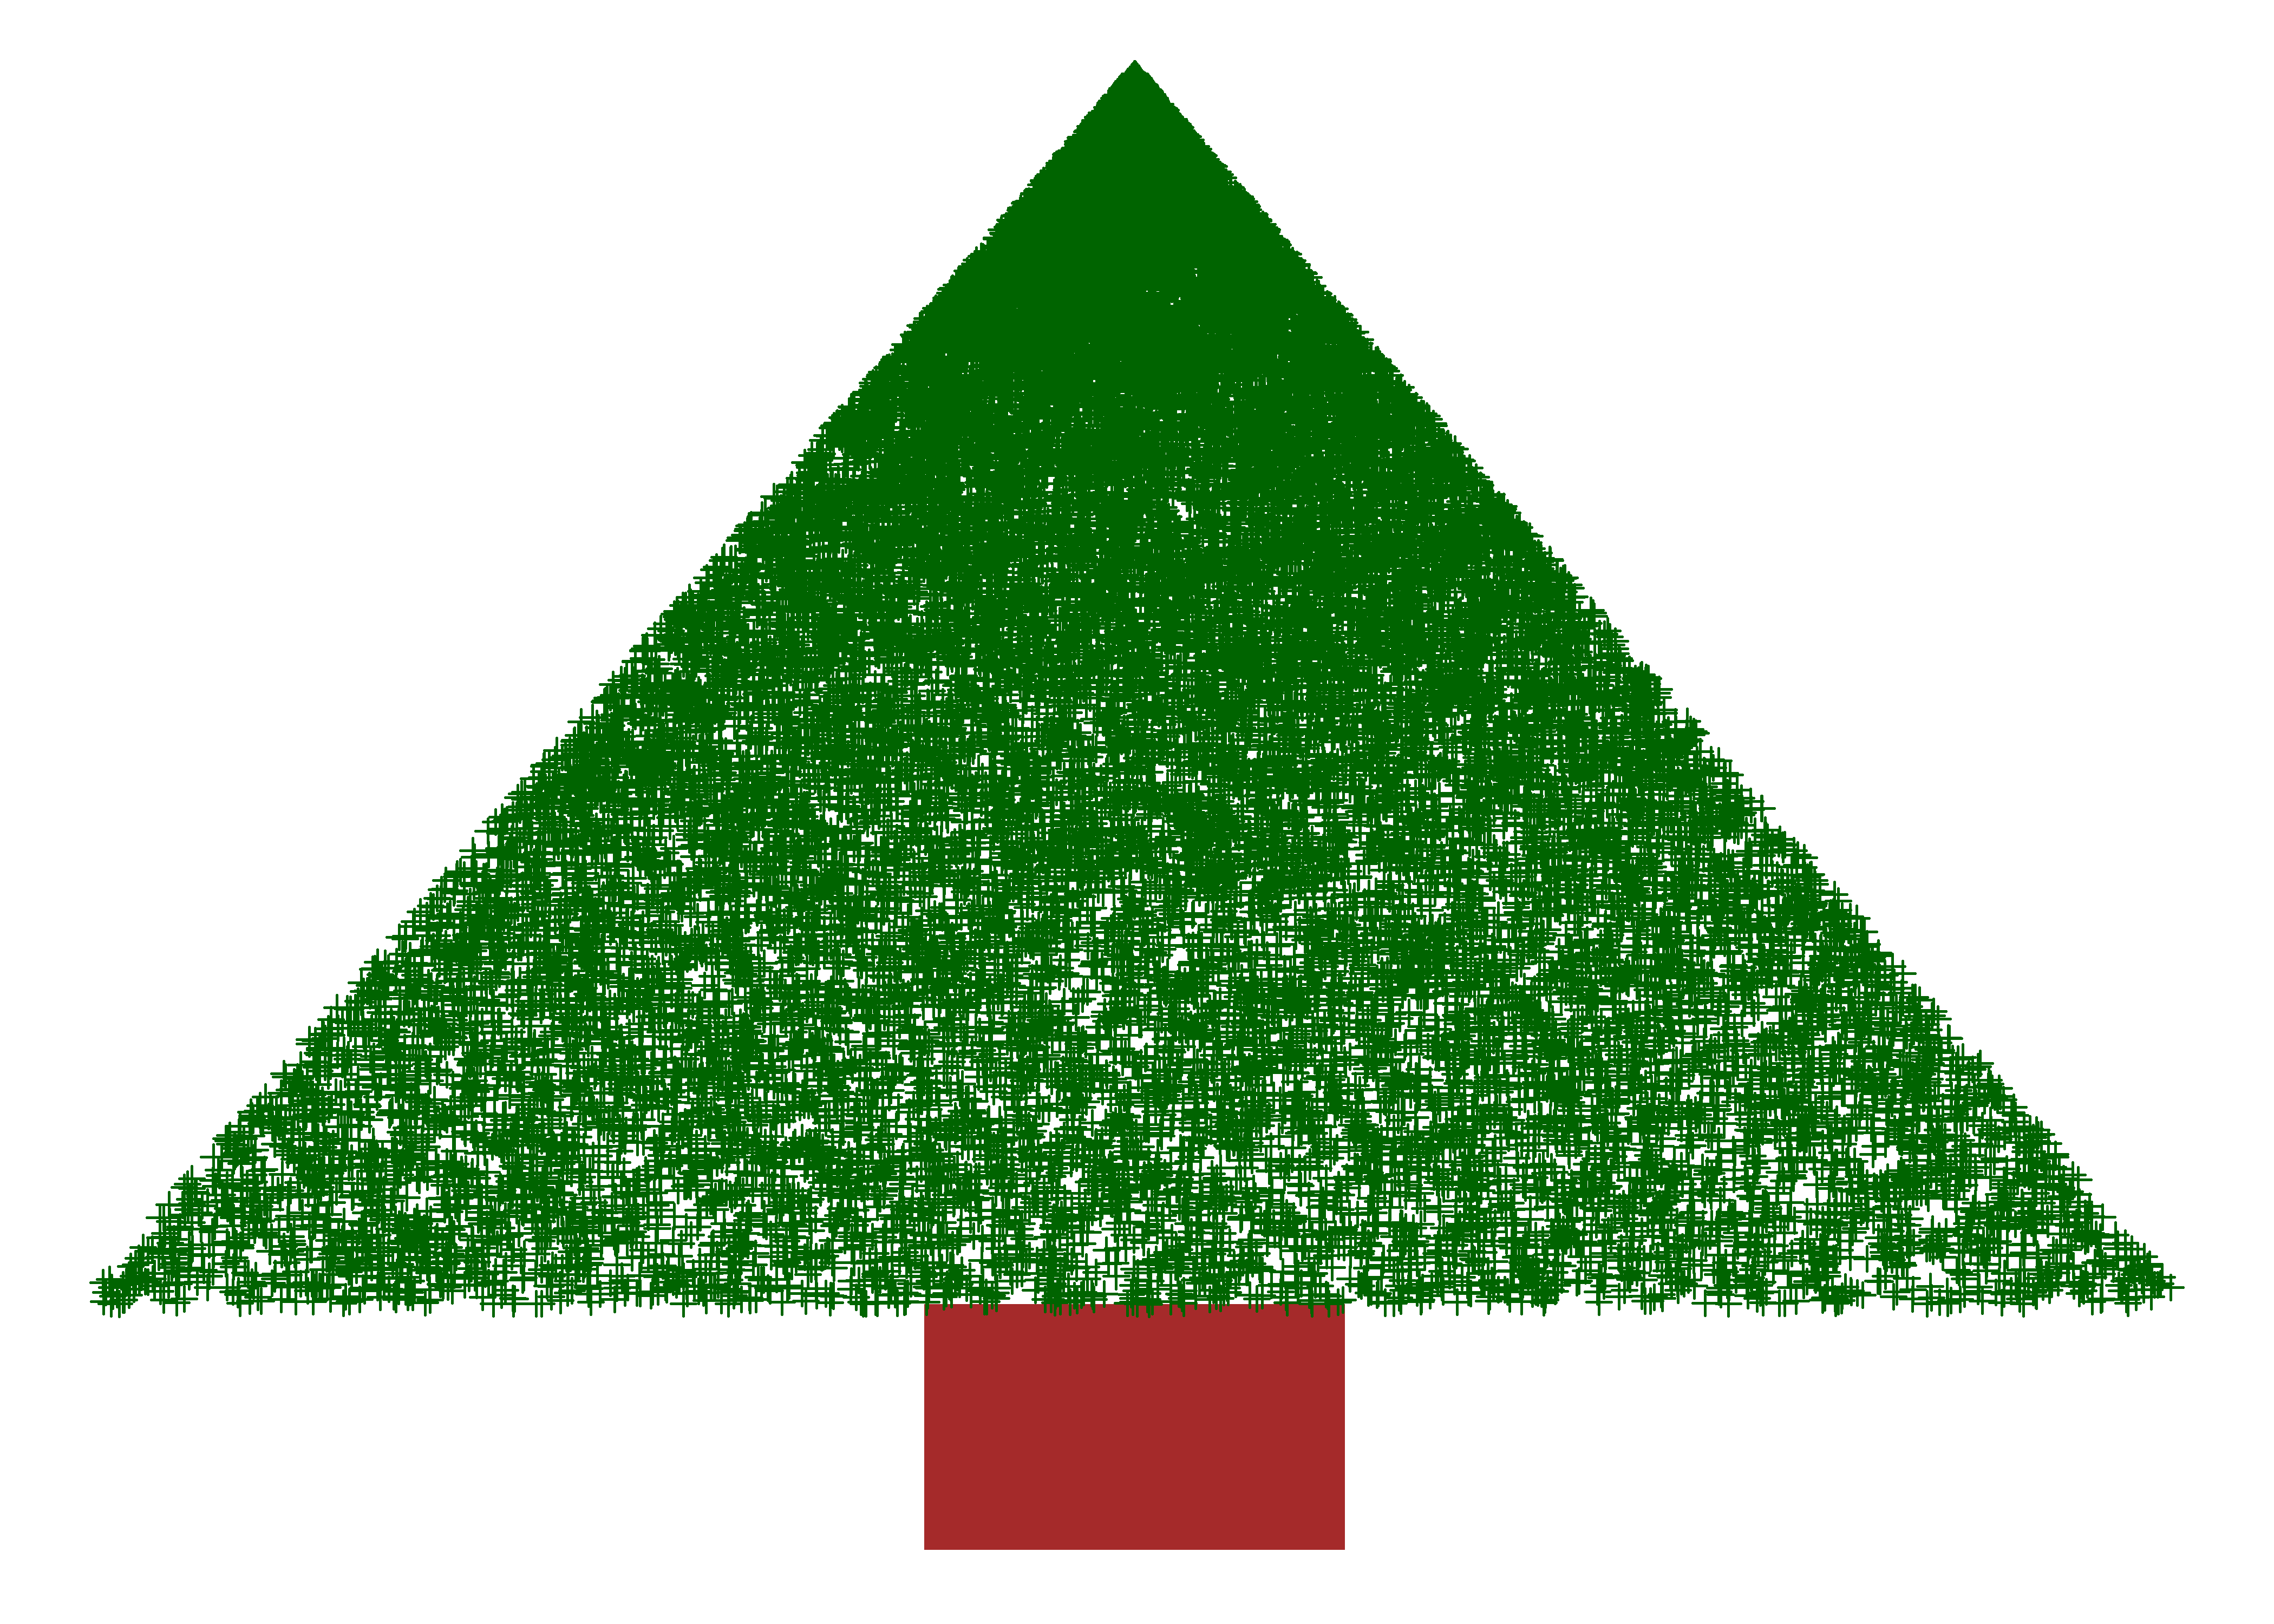
Hexagons
p2 <- ggplot() +
  geom_polygon(aes(x = x, y = y), data = trunk, fill = "brown") +
  geom_hex(aes(x = x.x4, y = x.V2), data = canopy) +
  scale_fill_viridis() +
  theme_void() +
  theme(legend.position = "none")

p2
2-D Bins
p3 <- ggplot() +
  geom_polygon(aes(x = x, y = y), data = trunk, fill = "brown") +
  geom_bin2d(aes(x = x.x4, y = x.V2), data = canopy) +
  scale_fill_viridis() +
  theme_void() +
  theme(legend.position = "none")

p3
2-D Density
p4 <- ggplot() +
  geom_polygon(aes(x = x, y = y), data = trunk, fill = "brown") +
  stat_density_2d(aes(x = x.x4, y = x.V2, fill = ..level..), data = canopy, geom = "polygon") +
  scale_fill_viridis() +
  theme_void() +
  theme(legend.position = "none")

p4
Combine all trees
library(patchwork)

p1 + p2 + p3 + p4 + plot_annotation(
  title = 'Merry Christmas 2021',
  theme = theme(plot.title = element_text(size = 18, hjust = 0.5)))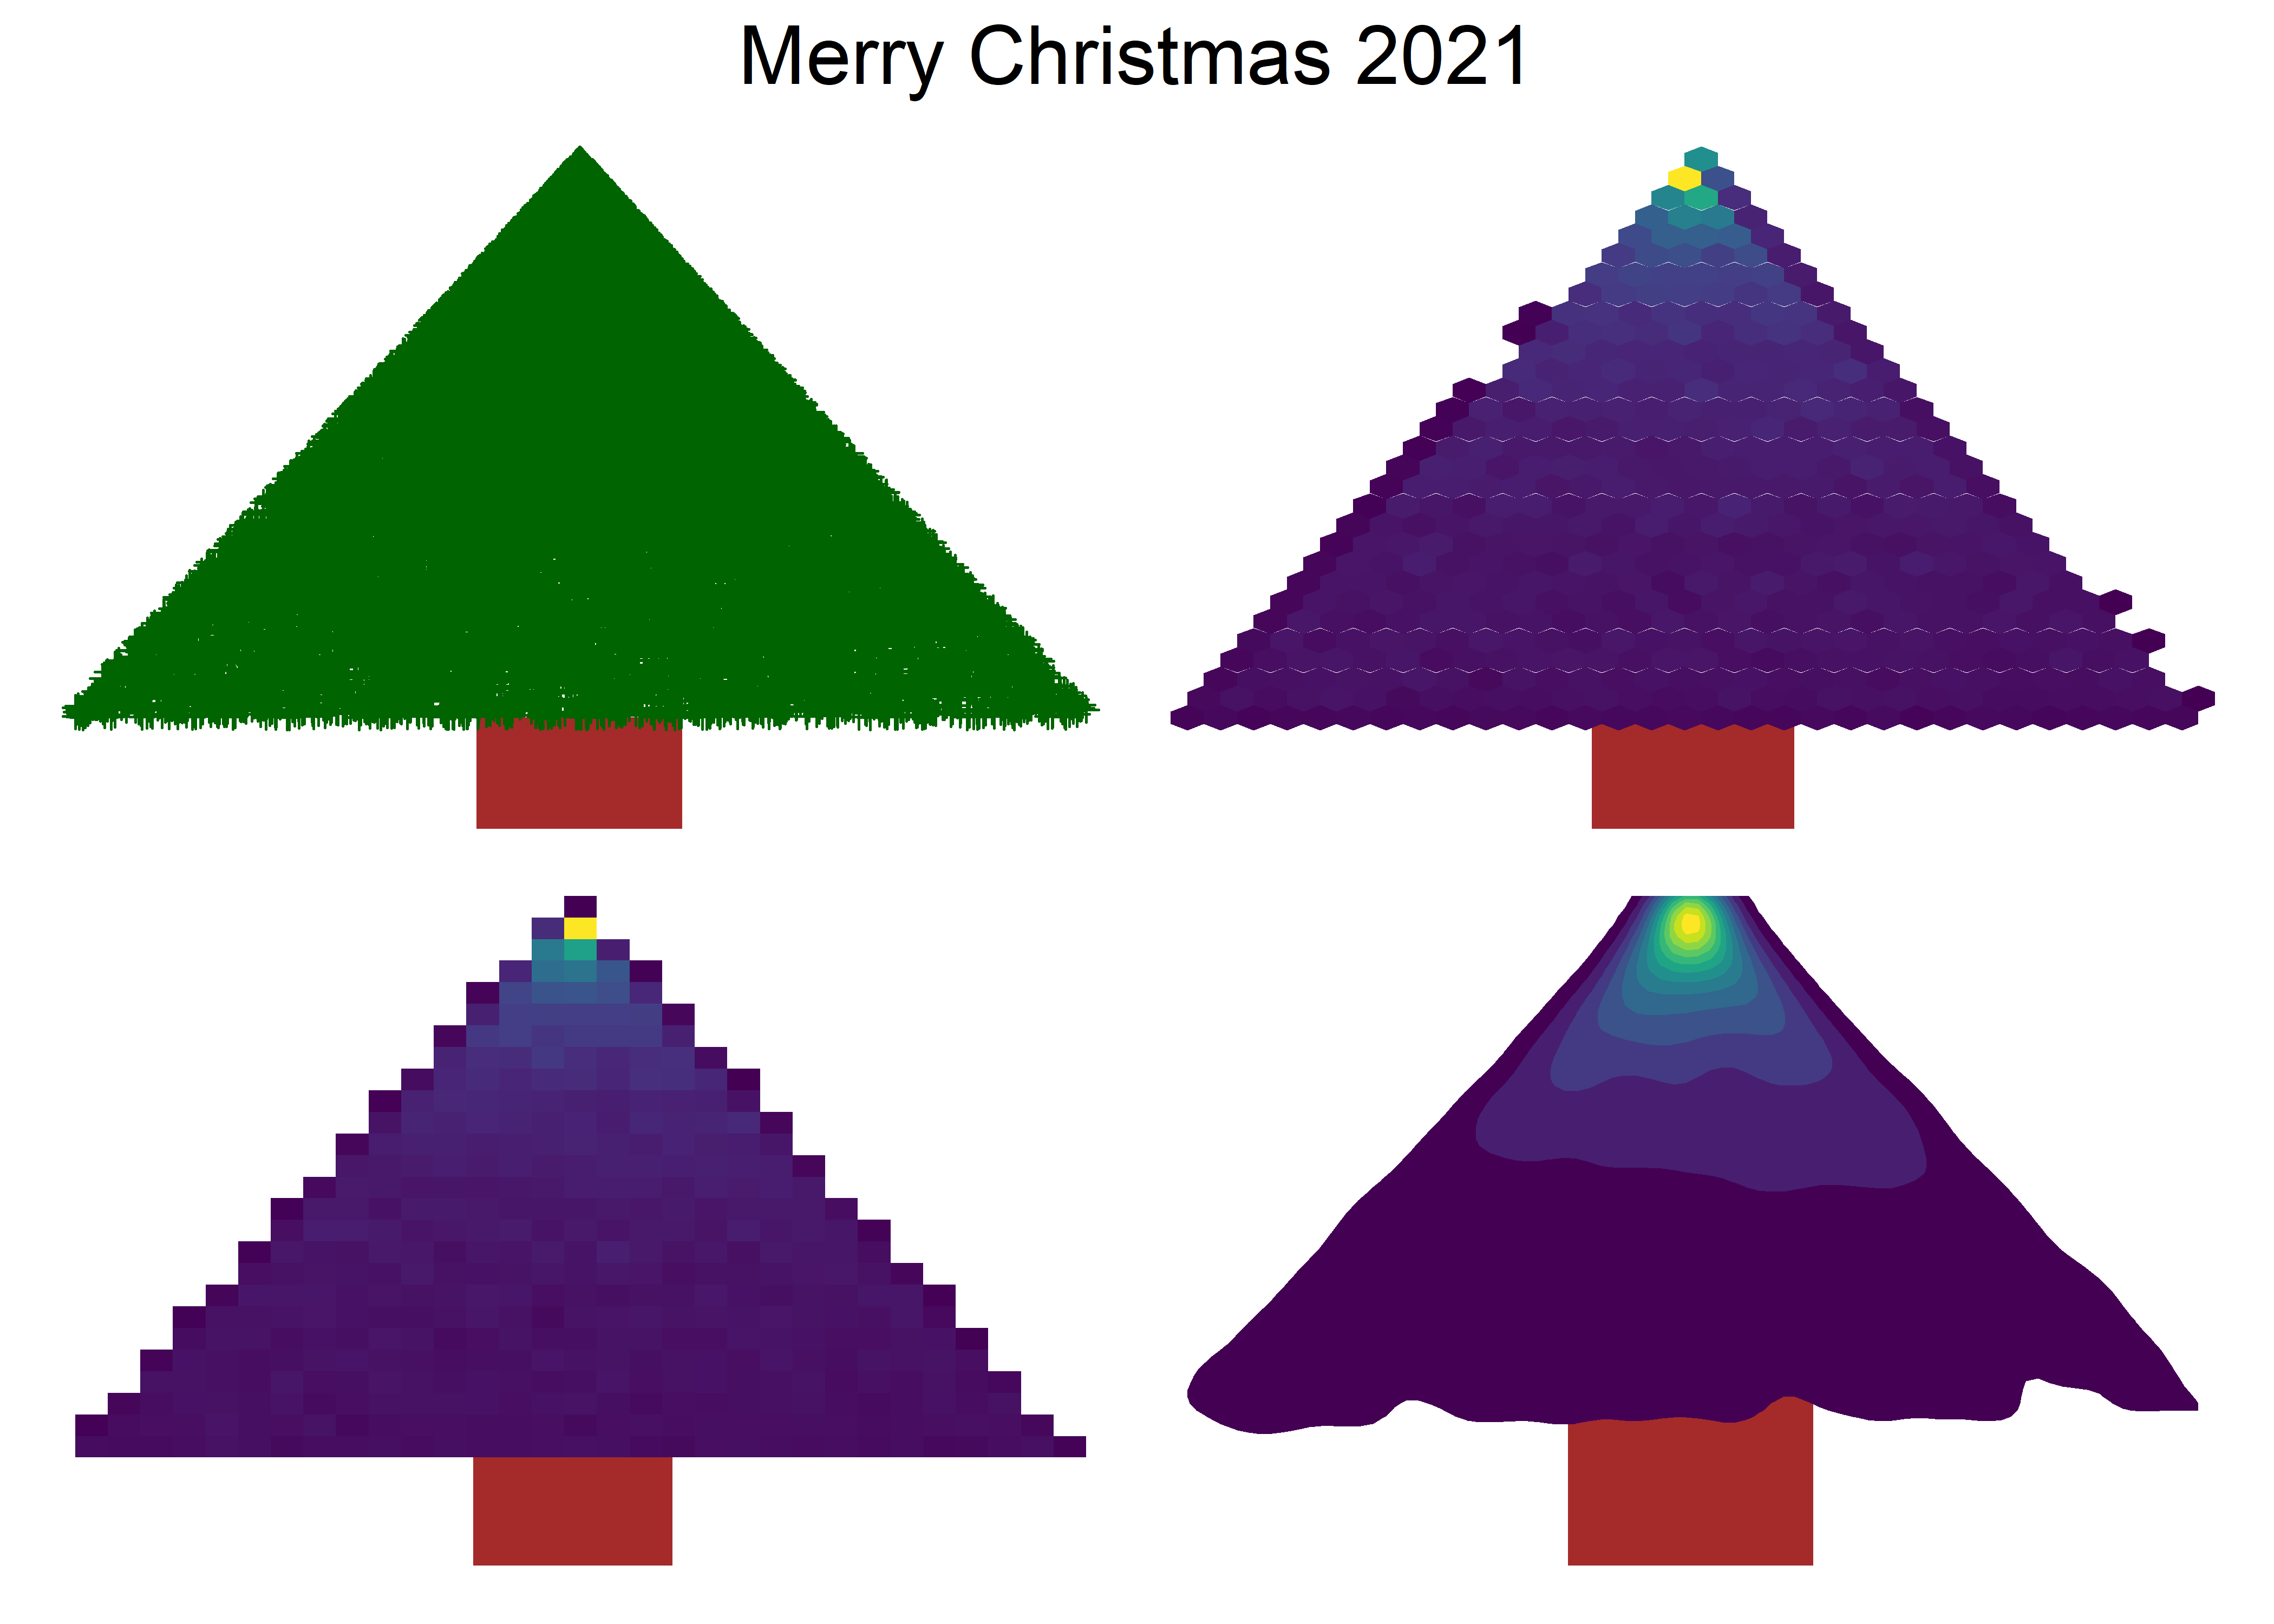
If you like it, please share with others also!
Muhammad Mohsin Raza
Data Scientist
My research interests include disease modeling in space and time, climate change, GIS and Remote Sensing and Data Science in Agriculture.