Art with R
There is a lot we can do with programming languages and so do with R. In my last post, I shared how we can generate different spatial patterns in R using some simple base functions like matrix and then visualize them using the ggplot2 package.
In this post, I’ll do some more creativity and show how we can use R to do artistic work and create beautiful target boards with points on them.
Accuracy and precision are vital concepts in machine learning, especially when assessing model quality for its prediction. Accuracy refers to how close a measurement is to the truth. In contrast, precision refers to how close measurements of the same class are to each other. Of course, both are independent of each other.
And those of you who are familiar with these terms might have come across the following figure that beautifully visualize these concepts.
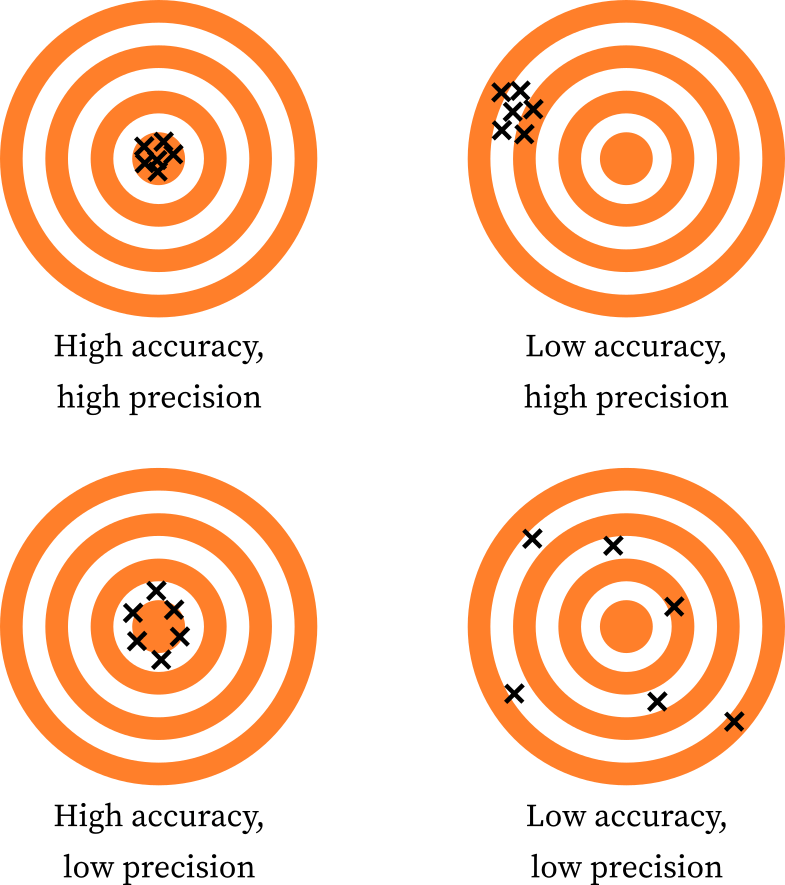
Accuracy and Precision
In this blog post, I’ll recreate these shapes with R using base plotting functions.
Simple shapes
We can use the base plot function in R to draw different shapes like circles, squares, triangles, etc. And using these shapes, we can do a lot.
A circle
plot(0, 0, cex = 12)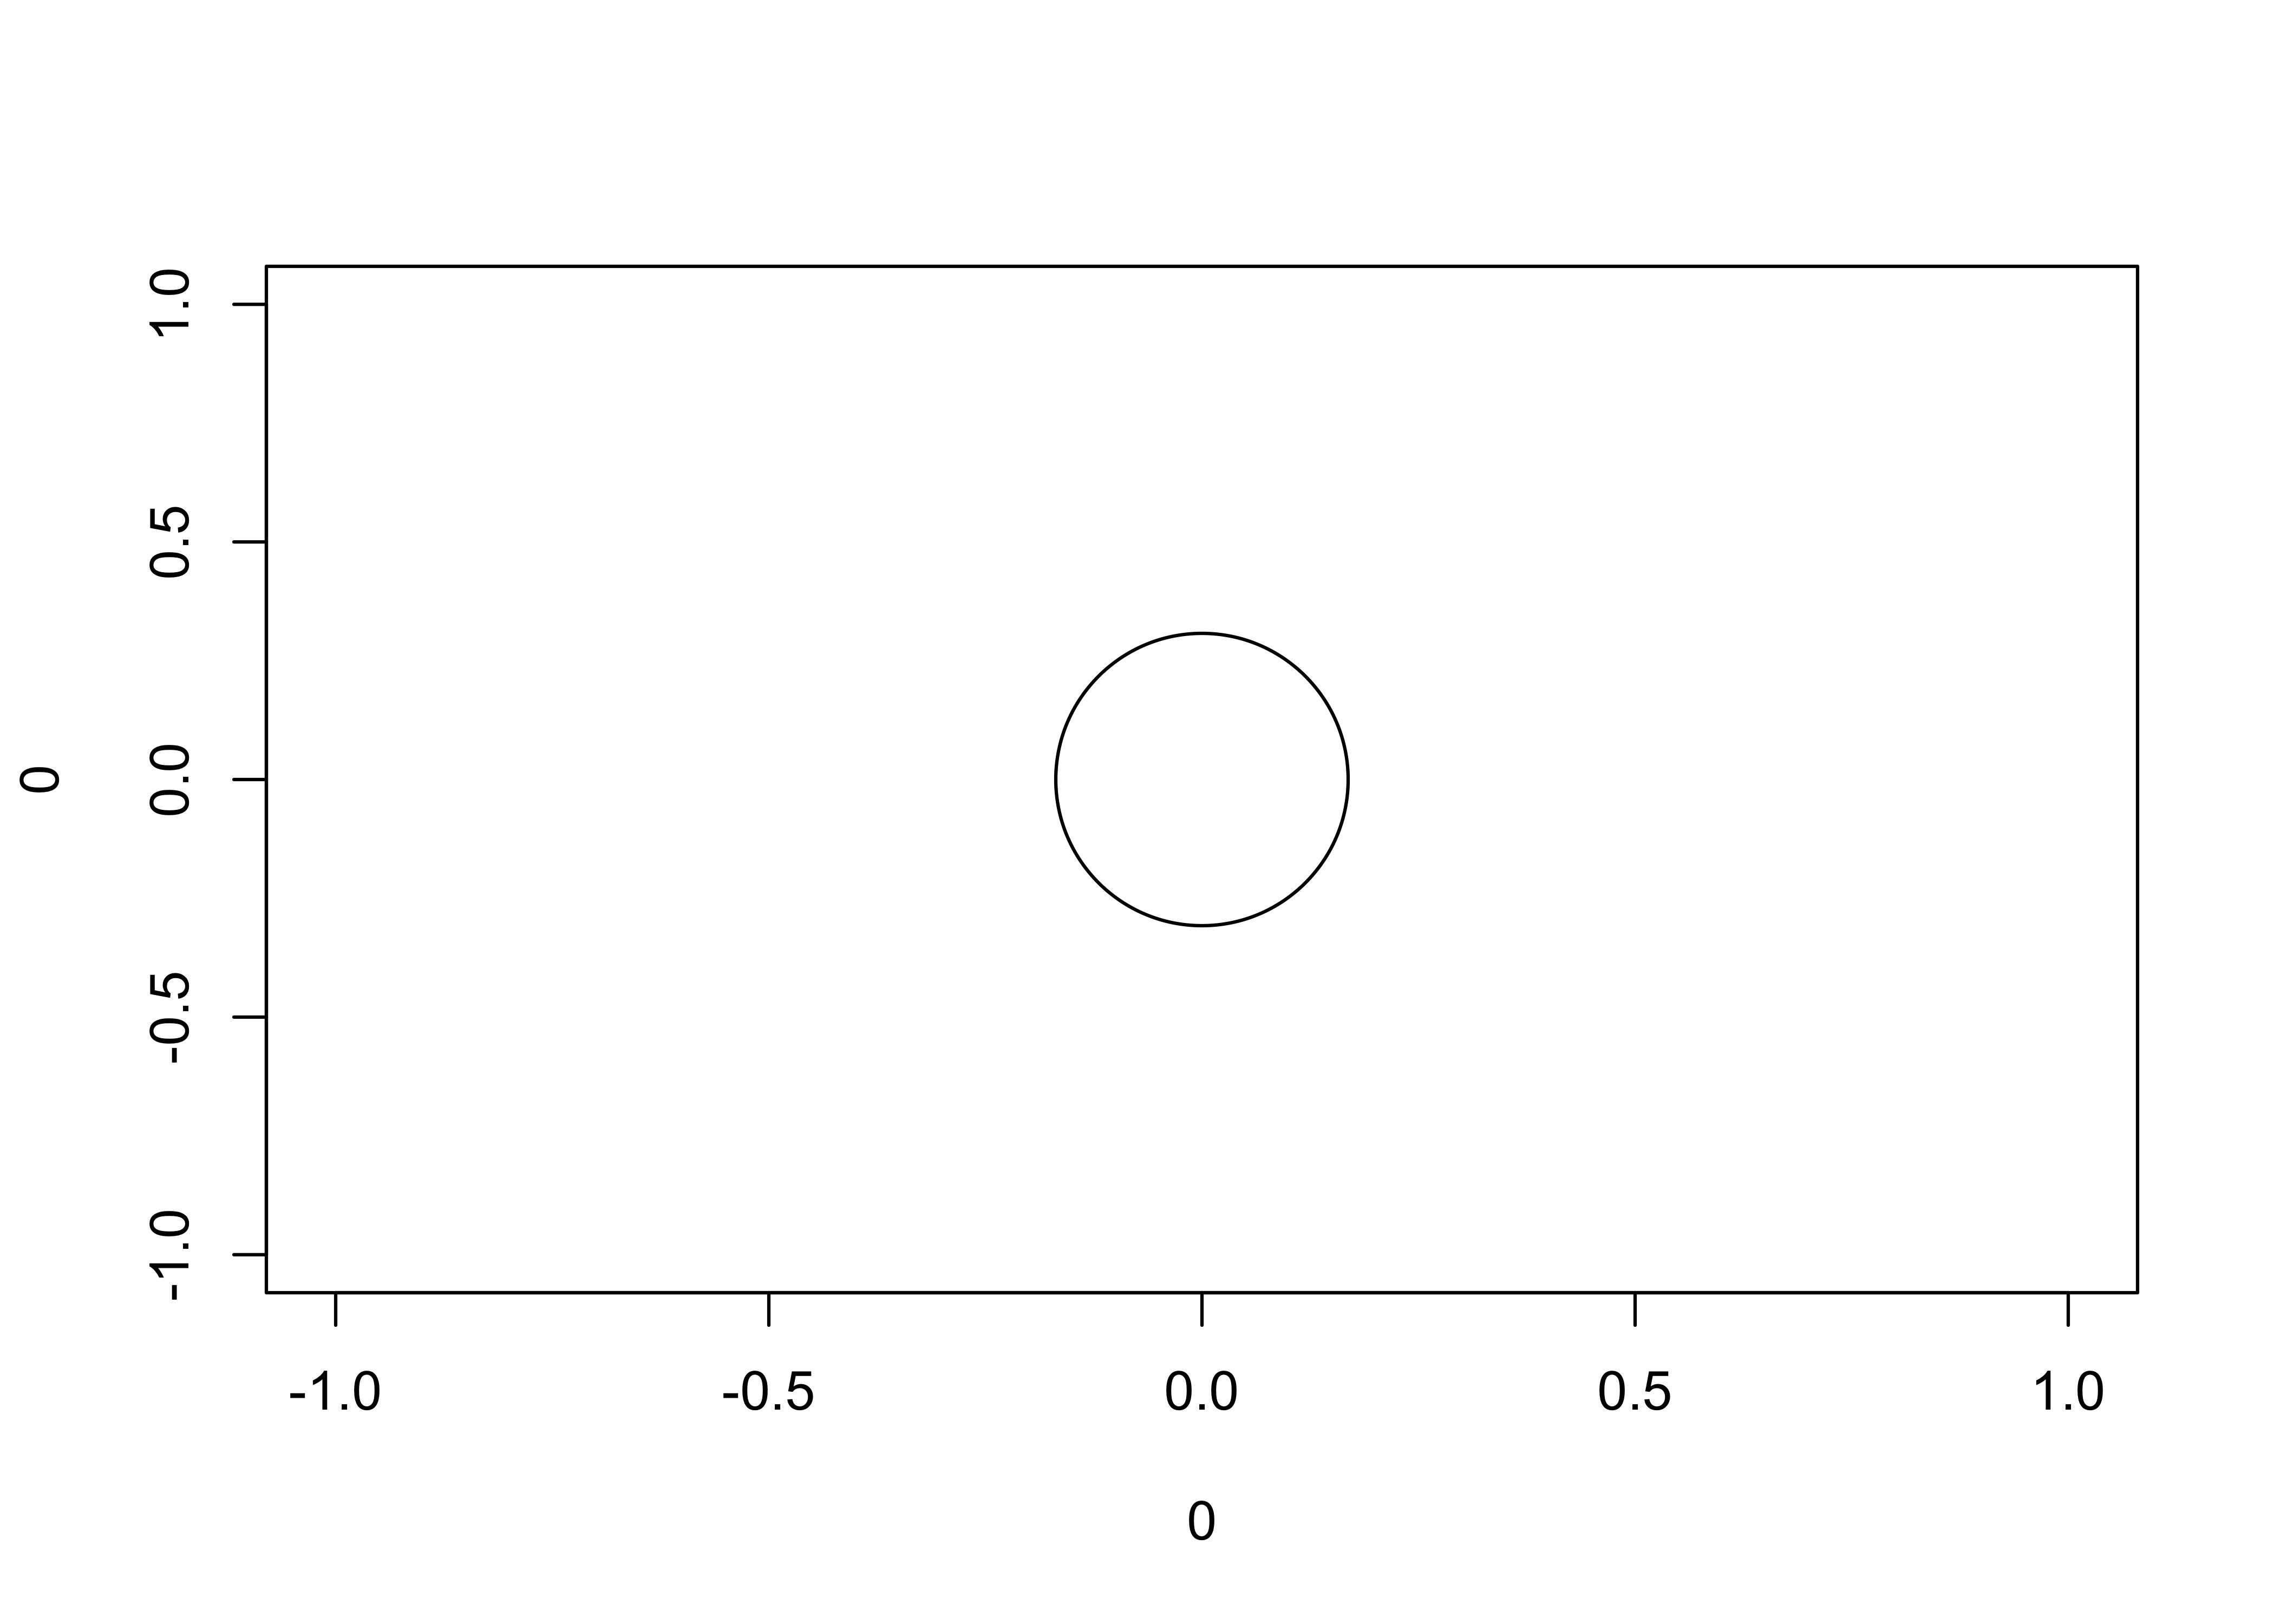
A triangle
plot(0, 0, cex = 12, pch = 2)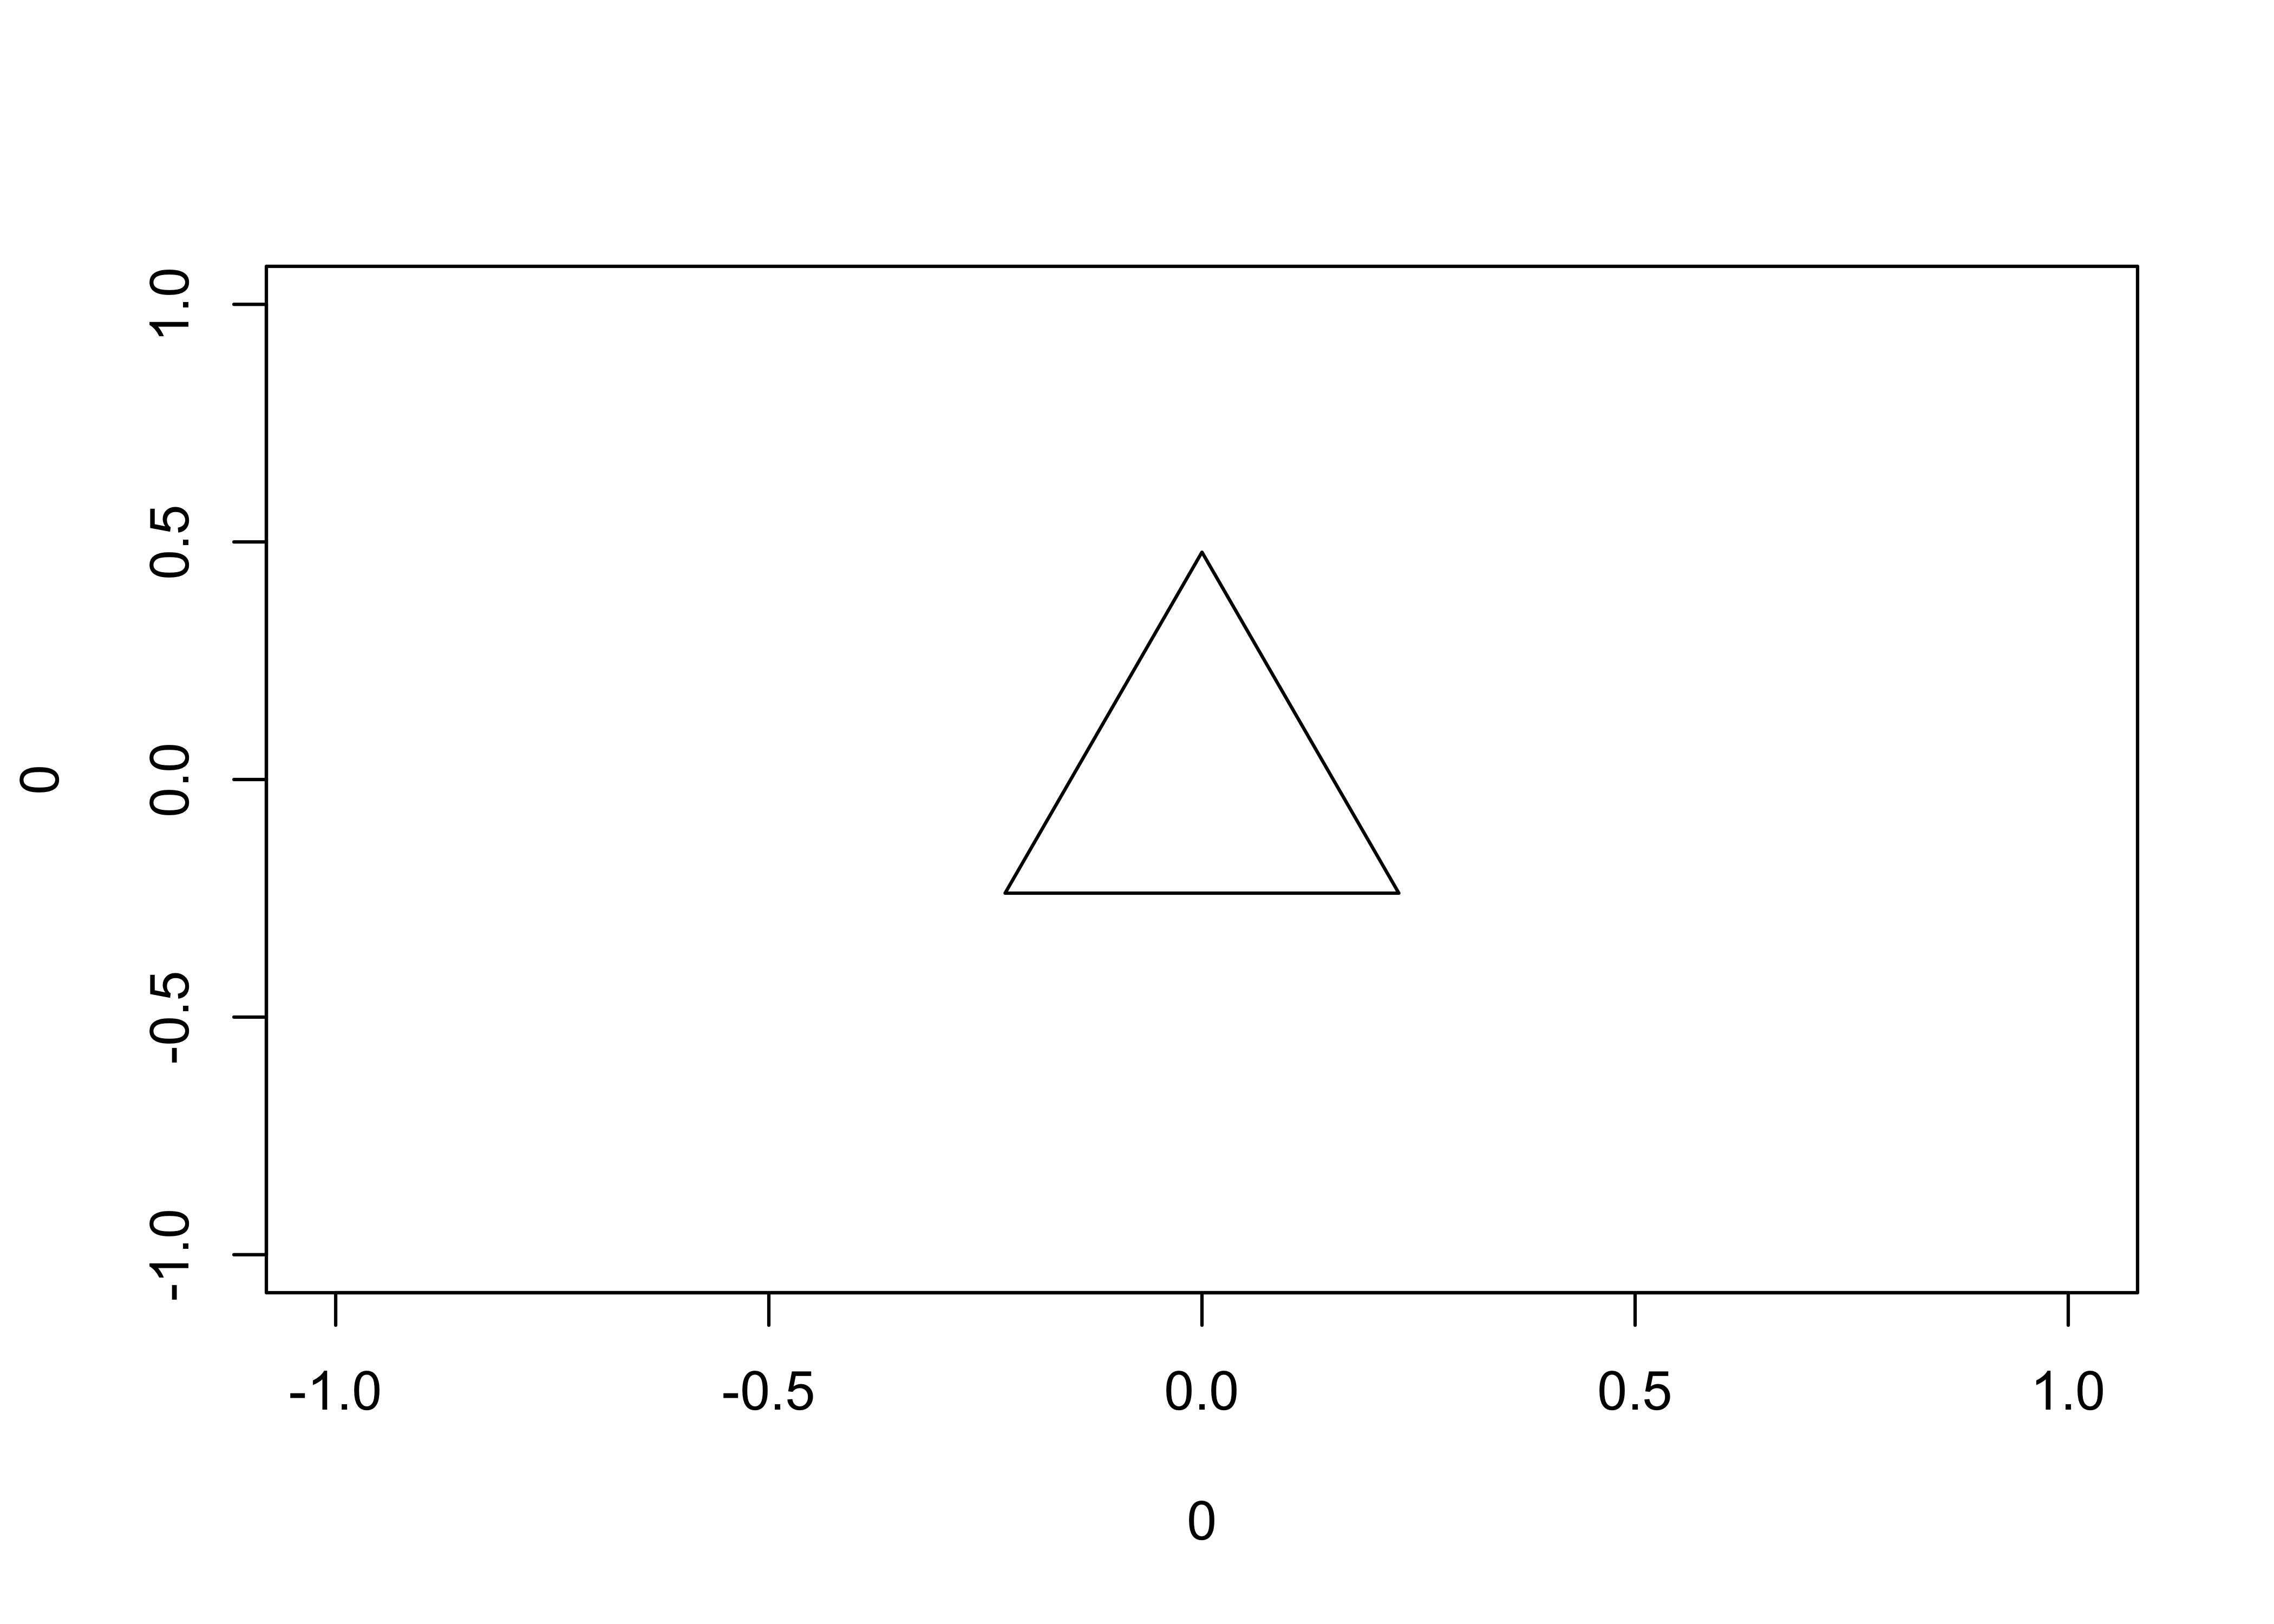
A square
plot(0, 0, cex = 12, pch = 0)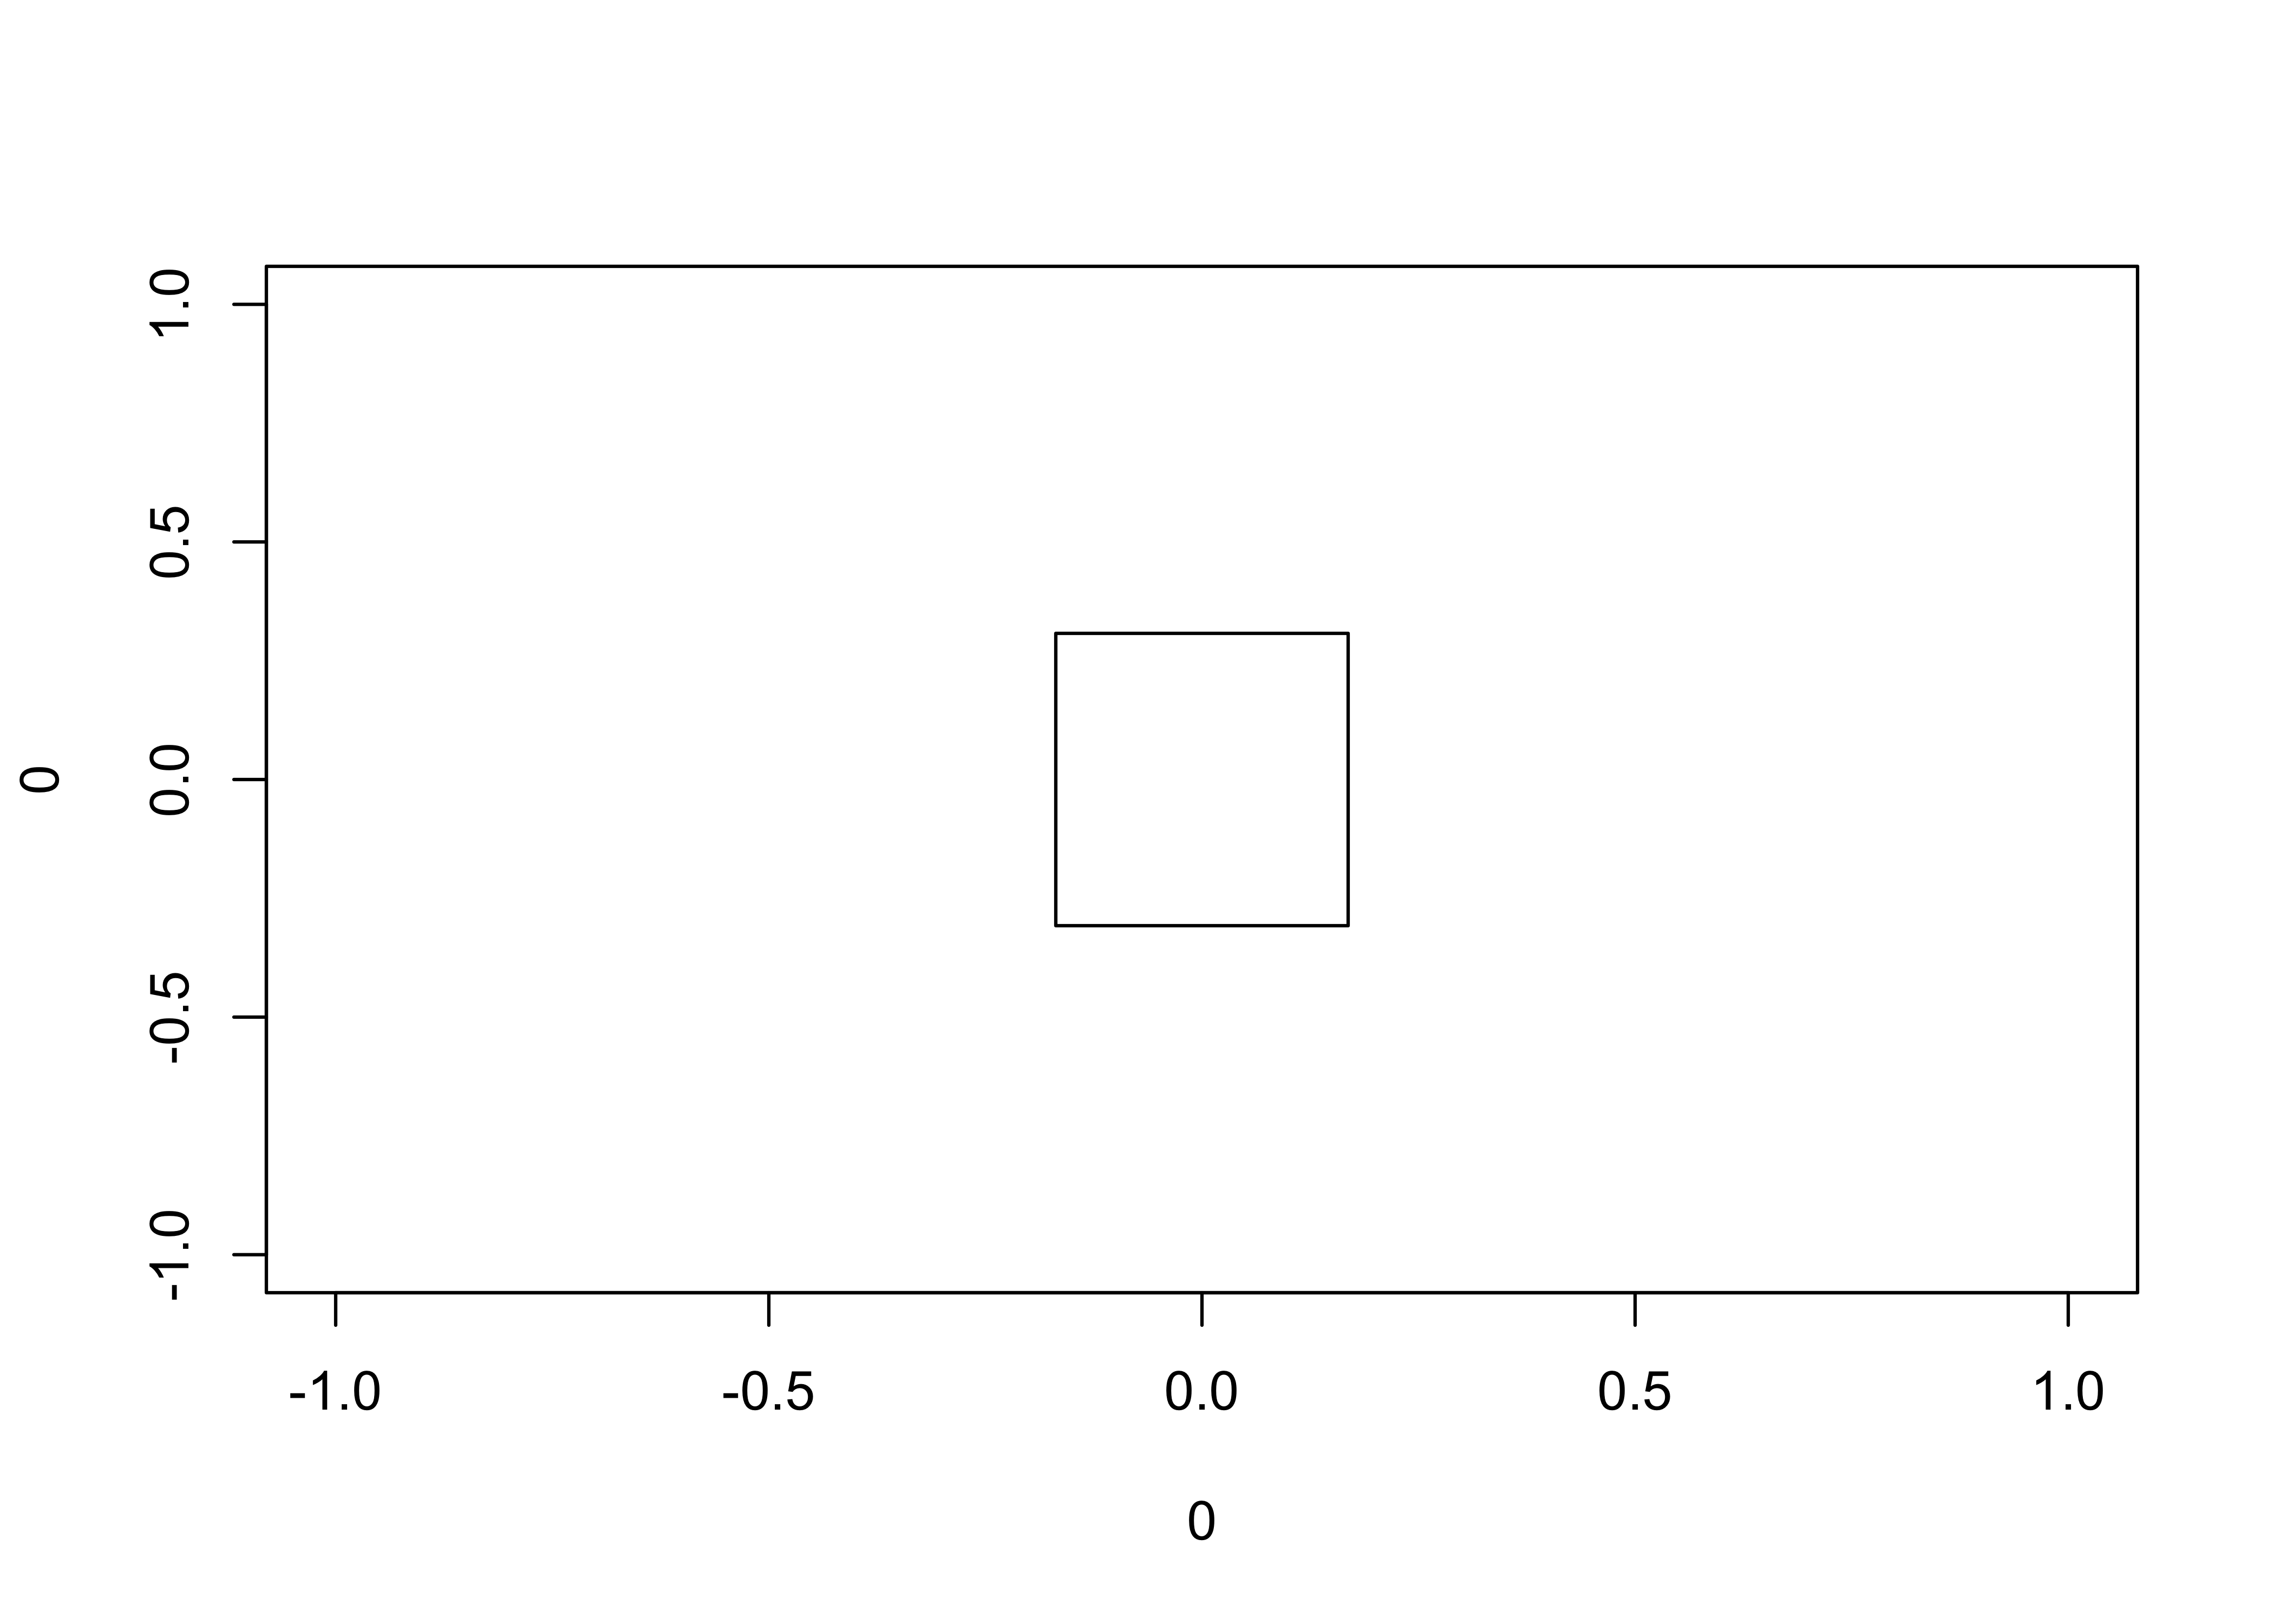
We can also combine these shapes in the same graph by plotting them together.
plot(0, 0, cex = 12)
points(0.5, 0.5, cex = 12, pch = 2)
points(-0.5, -0.5, cex = 12, pch = 0)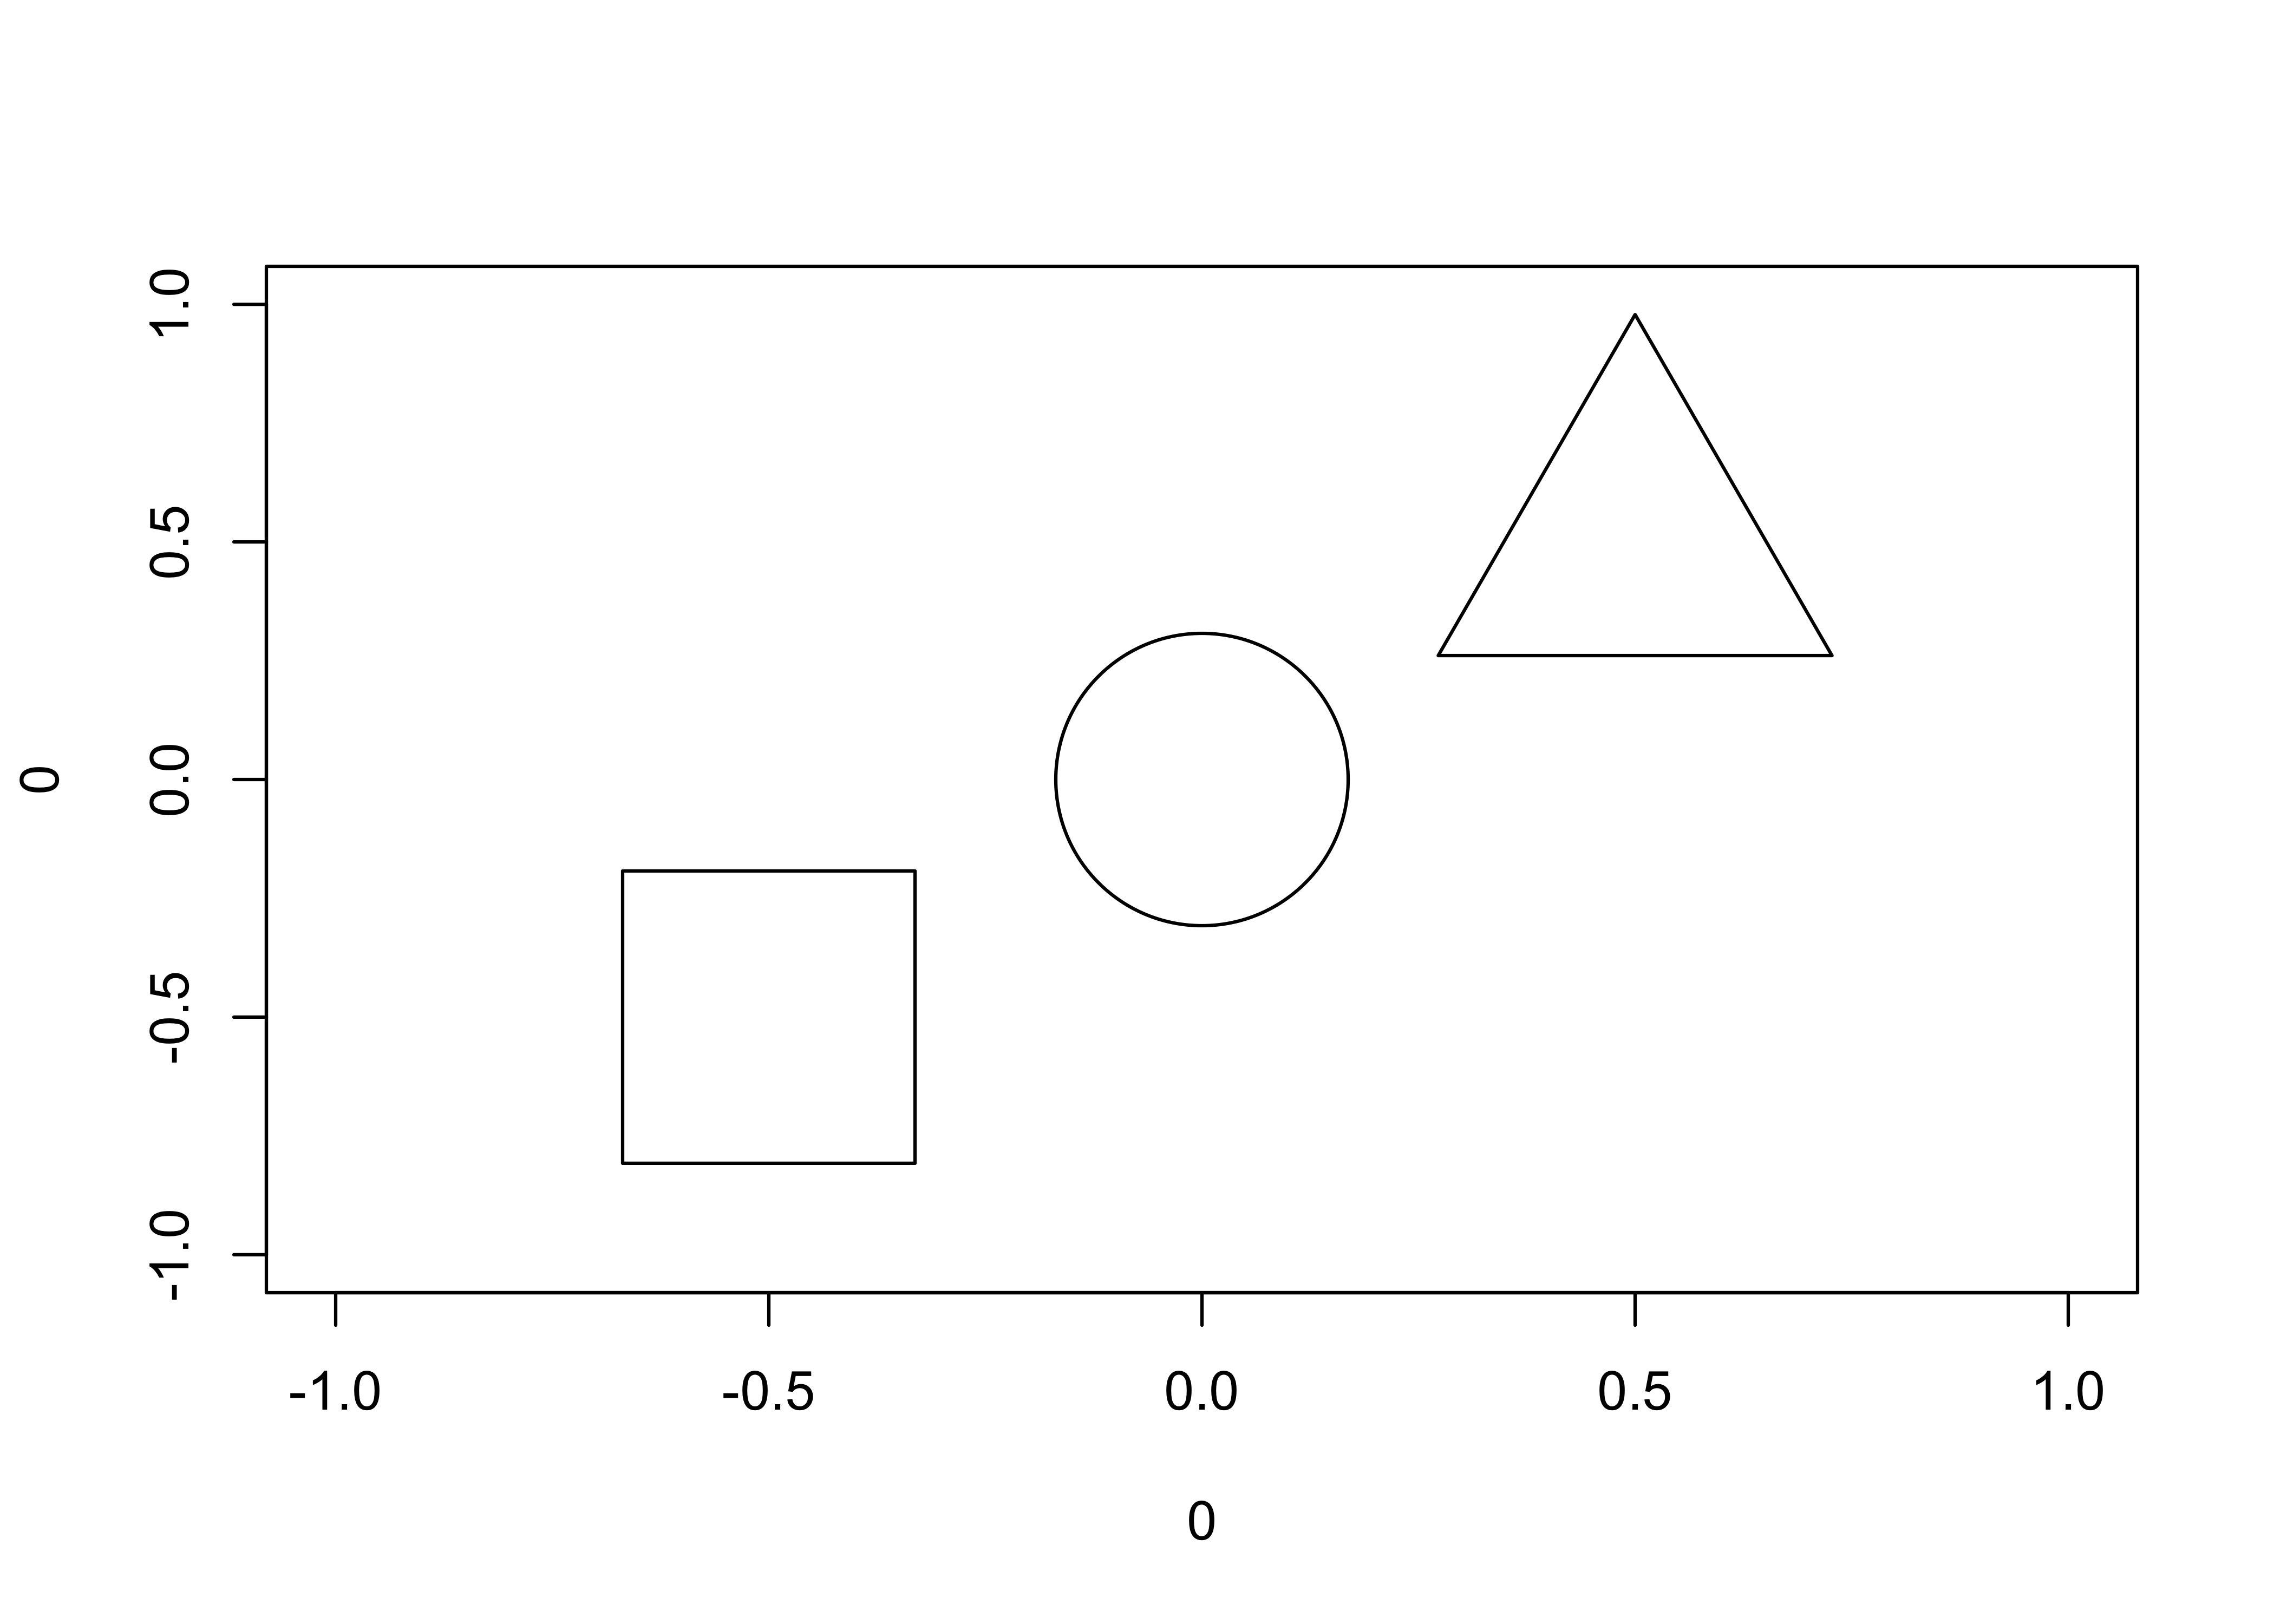
To make these colorful, we can fill them with colors of our choice.
plot(0, 0, cex = 12, pch = 21, bg = "orange")
points(0.5, 0.5, cex = 12, pch = 24, bg = "green")
points(-0.5, -0.5, cex = 12, pch = 22, bg = "blue")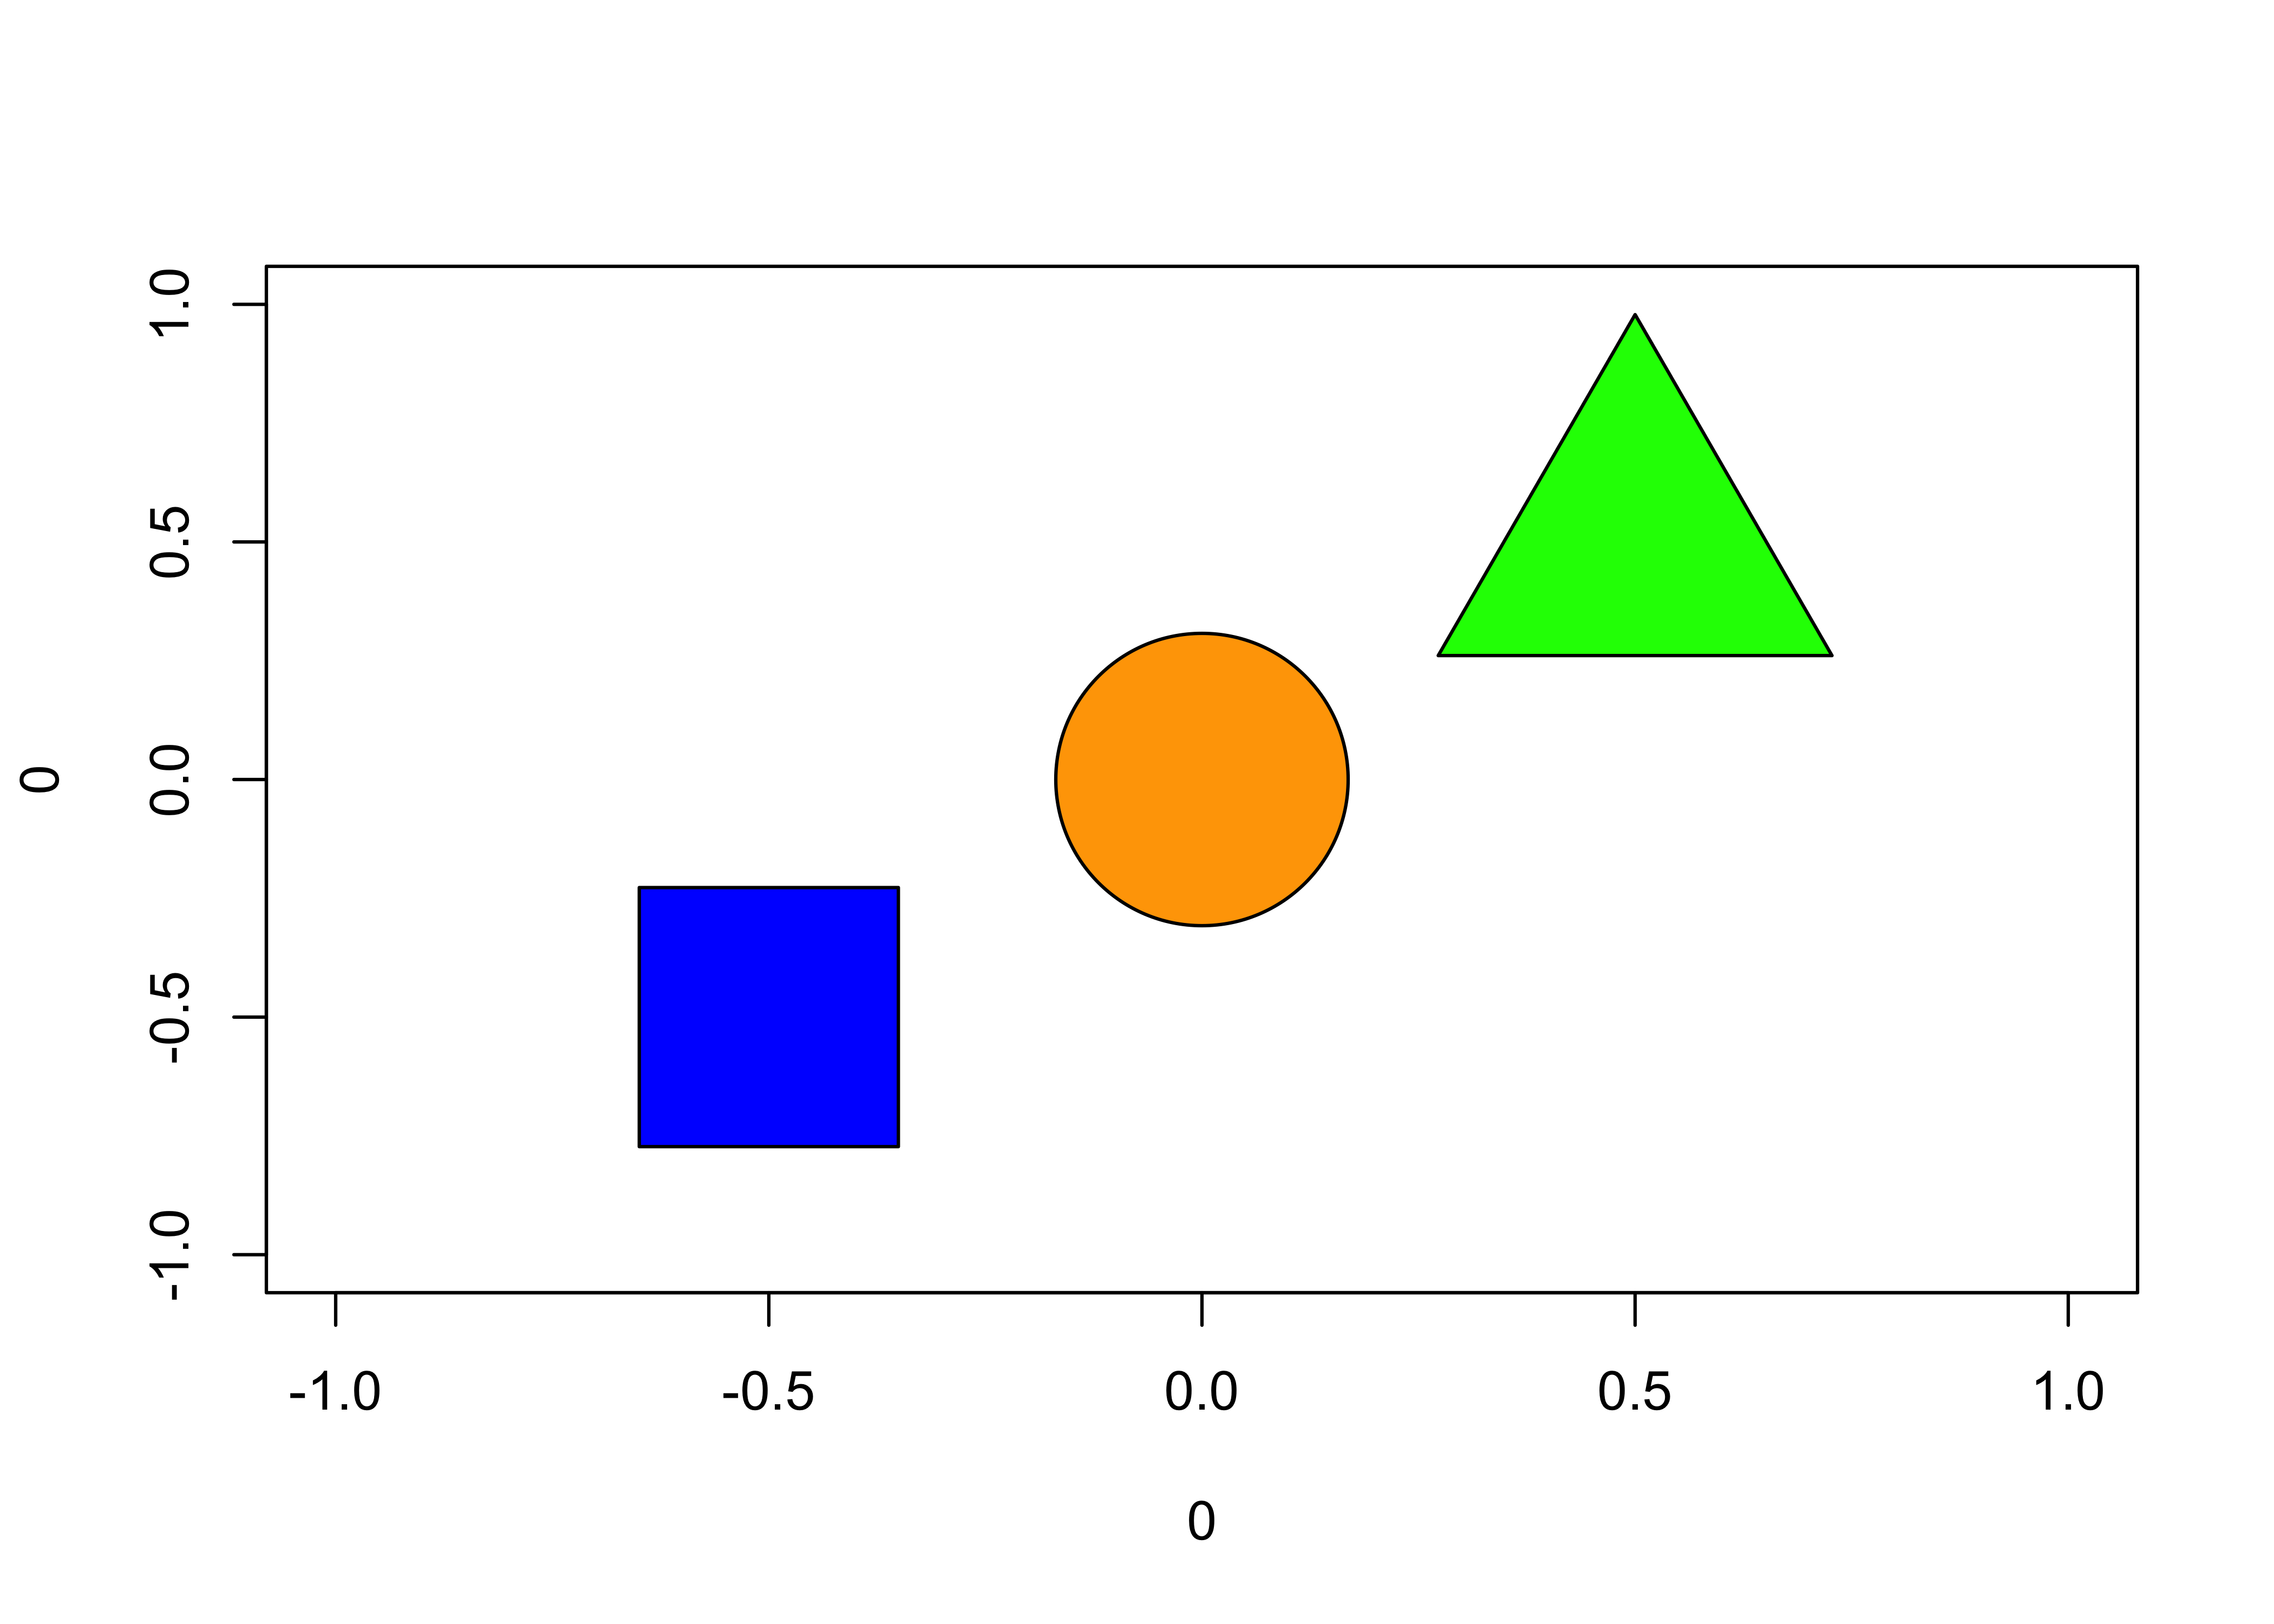
Coming back to the business i.e., target board. For that purpose, we can use circles of different sizes, lay them over each other, and fill them with different colors, i.e., orange and white. At first, we can start with a large orange circle (cex = 45) followed by correspondingly smaller circles with different colors.
# target board
plot(0, 0, cex = 45, pch = 21, bg = "orange", col = "black")
points(0, 0, cex = 39, pch = 21, bg = "white", col = "white")
points(0, 0, cex = 33, pch = 21, bg = "orange", col = "orange")
points(0, 0, cex = 27, pch = 21, bg = "white", col = "white")
points(0, 0, cex = 21, pch = 21, bg = "orange", col = "orange")
points(0, 0, cex = 15, pch = 21, bg = "white", col = "white")
points(0, 0, cex = 9, pch = 21, bg = "orange", col = "orange")
points(0, 0, cex = 3, pch = 21, bg = "white", col = "white")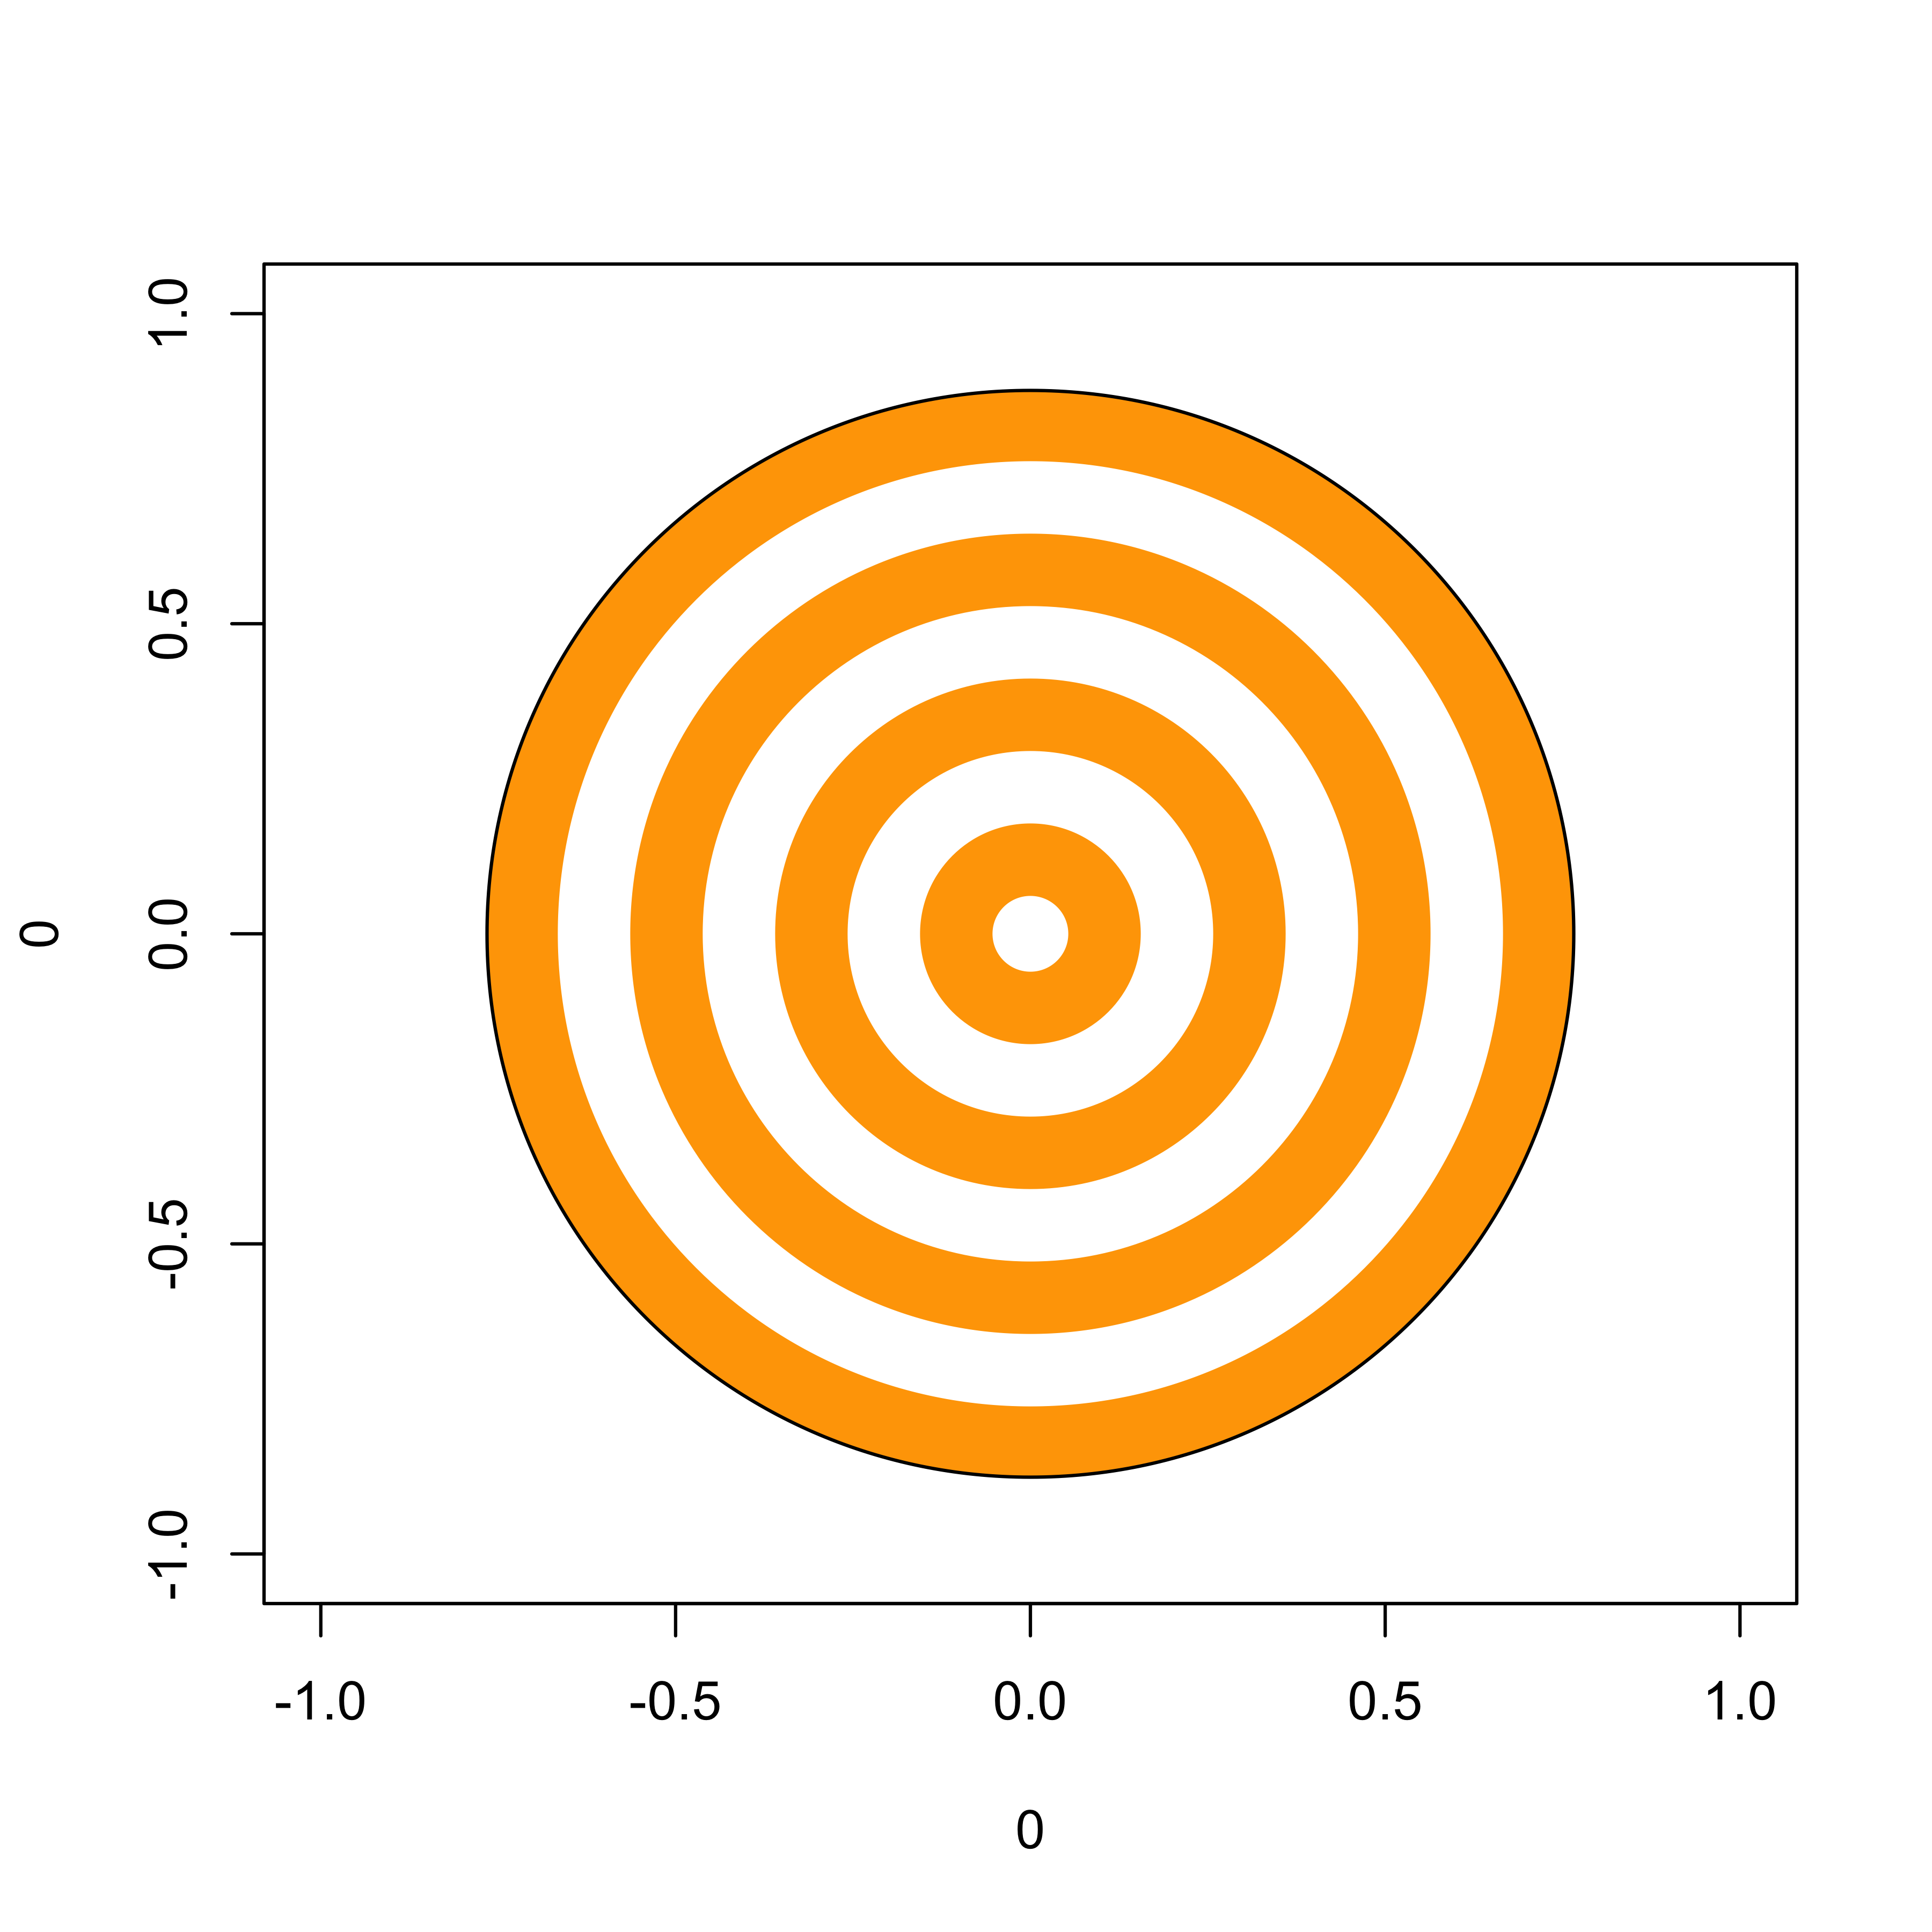
Now, I’ll draw five target points (multiply sign) close to each other in the center of the circles and remove the axis titles and the borderline
# target board
plot(0, 0, cex = 45, pch = 21, bg = "orange", col = "black", axes=F, xlab = NA, ylab = NA)
points(0, 0, cex = 39, pch = 21, bg = "white", col = "white")
points(0, 0, cex = 33, pch = 21, bg = "orange", col = "orange")
points(0, 0, cex = 27, pch = 21, bg = "white", col = "white")
points(0, 0, cex = 21, pch = 21, bg = "orange", col = "orange")
points(0, 0, cex = 15, pch = 21, bg = "white", col = "white")
points(0, 0, cex = 9, pch = 21, bg = "orange", col = "orange")
points(0, 0, cex = 3, pch = 21, bg = "white", col = "white")

# target points
points(0, 0, pch = 4, lwd = 2, cex = 1.5, col = "blue")
points(0, 0.1, pch = 4, lwd = 2, cex = 1.5, col = "blue")
points(0, -0.1, pch = 4, lwd = 2, cex = 1.5, col = "blue")
points(0.1, 0, pch = 4, lwd = 2, cex = 1.5, col = "blue")
points(-0.1, 0, pch = 4, lwd = 2, cex = 1.5, col = "blue")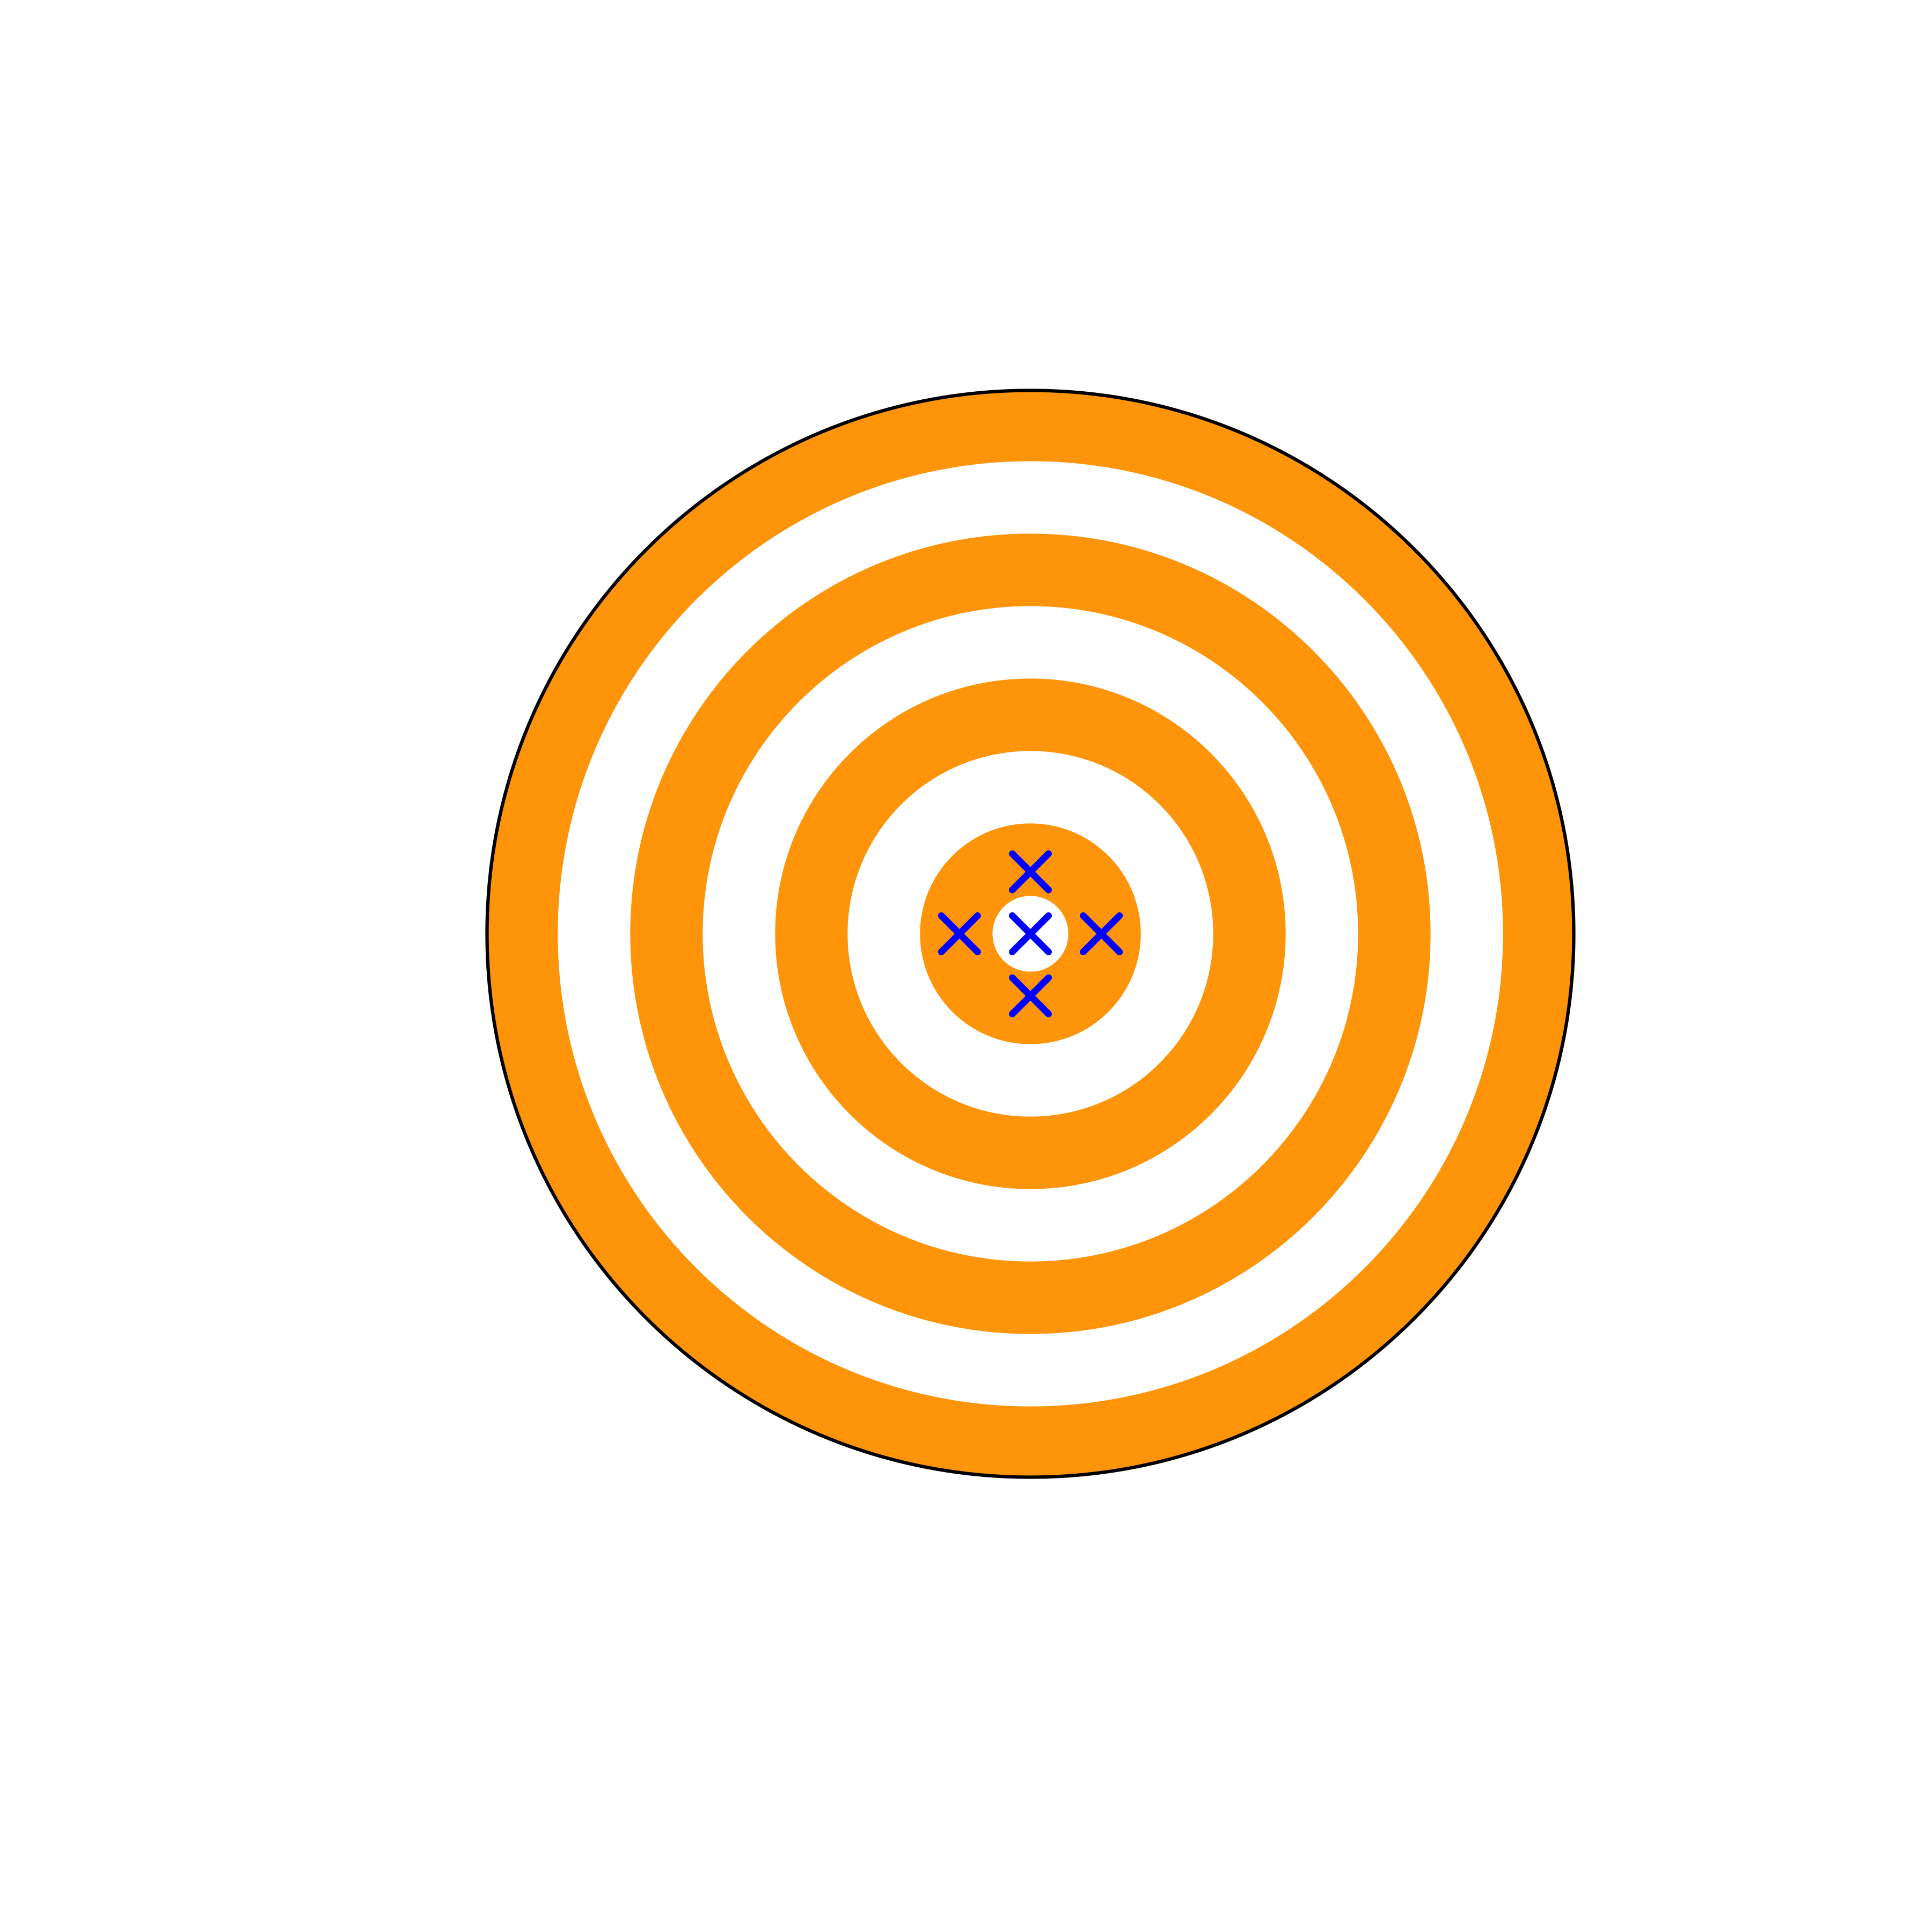
As we have the base code to generate a target board figure, I’ll make a function using this code to use in the following sections to reduce repetition.
# target board function
target_board <- function(title) {
  plot(0, 0, cex = 45, pch = 21, bg = "orange", col = "black", axes=F, main = title, xlab = NA, ylab = NA)
  points(0, 0, cex = 39, pch = 21, bg = "white", col = "white")
  points(0, 0, cex = 33, pch = 21, bg = "orange", col = "orange")
  points(0, 0, cex = 27, pch = 21, bg = "white", col = "white")
  points(0, 0, cex = 21, pch = 21, bg = "orange", col = "orange")
  points(0, 0, cex = 15, pch = 21, bg = "white", col = "white")
  points(0, 0, cex = 9, pch = 21, bg = "orange", col = "orange")
  points(0, 0, cex = 3, pch = 21, bg = "white", col = "white")
}
Target boards with varying accuracy and precision
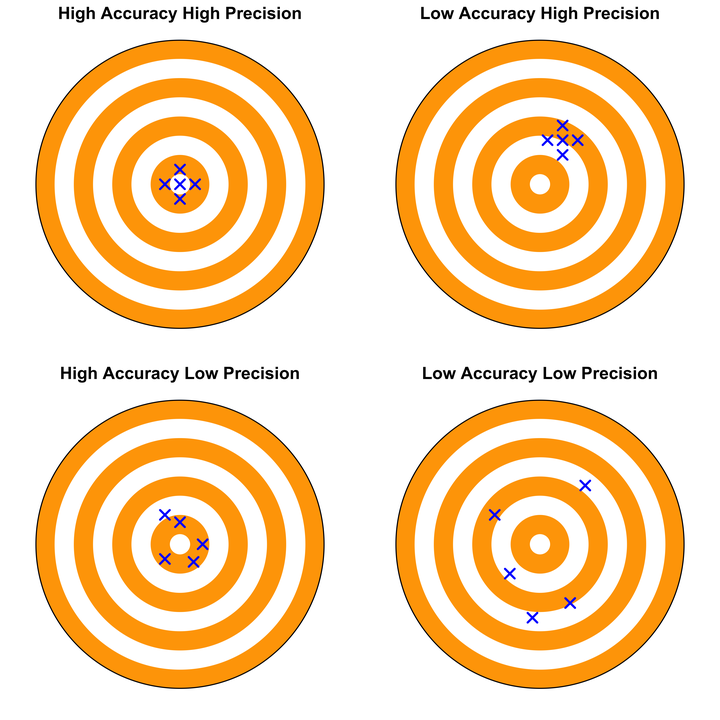
Now, I’ll use the target board function to generate four different target boards and target points at various locations to show different accuracy and precision levels.
# 2 by 2 grid
par(mfrow = c(2, 2))

# remove extra white space
par(mar = c(1, 1, 1.5, 1))

# High Accuracy High Precision
target_board(title = "High Accuracy High Precision")
points(0, 0, pch = 4, lwd = 2, cex = 1.5, col = "blue")
points(0, 0.1, pch = 4, lwd = 2, cex = 1.5, col = "blue")
points(0, -0.1, pch = 4, lwd = 2, cex = 1.5, col = "blue")
points(0.1, 0, pch = 4, lwd = 2, cex = 1.5, col = "blue")
points(-0.1, 0, pch = 4, lwd = 2, cex = 1.5, col = "blue")

# Low Accuracy High Precision
target_board(title = "Low Accuracy High Precision")
points(0.15, 0.3, pch = 4, lwd = 2, cex = 1.5, col = "blue")
points(0.15, 0.4, pch = 4, lwd = 2, cex = 1.5, col = "blue")
points(0.15, 0.2, pch = 4, lwd = 2, cex = 1.5, col = "blue")
points(0.25, 0.3, pch = 4, lwd = 2, cex = 1.5, col = "blue")
points(0.05, 0.3, pch = 4, lwd = 2, cex = 1.5, col = "blue")

# High Accuracy Low Precision
target_board(title = "High Accuracy Low Precision")
points(0, 0.15, pch = 4, lwd = 2, cex = 1.5, col = "blue")
points(-0.1, 0.2, pch = 4, lwd = 2, cex = 1.5, col = "blue")
points(0.09, -0.12, pch = 4, lwd = 2, cex = 1.5, col = "blue")
points(0.15, 0, pch = 4, lwd = 2, cex = 1.5, col = "blue")
points(-0.1, -0.1, pch = 4, lwd = 2, cex = 1.5, col = "blue")

# Low Accuracy Low Precision
target_board(title = "Low Accuracy Low Precision")
points(0.3, 0.4, pch = 4, lwd = 2, cex = 1.5, col = "blue")
points(-0.3, 0.2, pch = 4, lwd = 2, cex = 1.5, col = "blue")
points(-0.2, -0.2, pch = 4, lwd = 2, cex = 1.5, col = "blue")
points(0.2, -0.4, pch = 4, lwd = 2, cex = 1.5, col = "blue")
points(-0.05, -0.5, pch = 4, lwd = 2, cex = 1.5, col = "blue")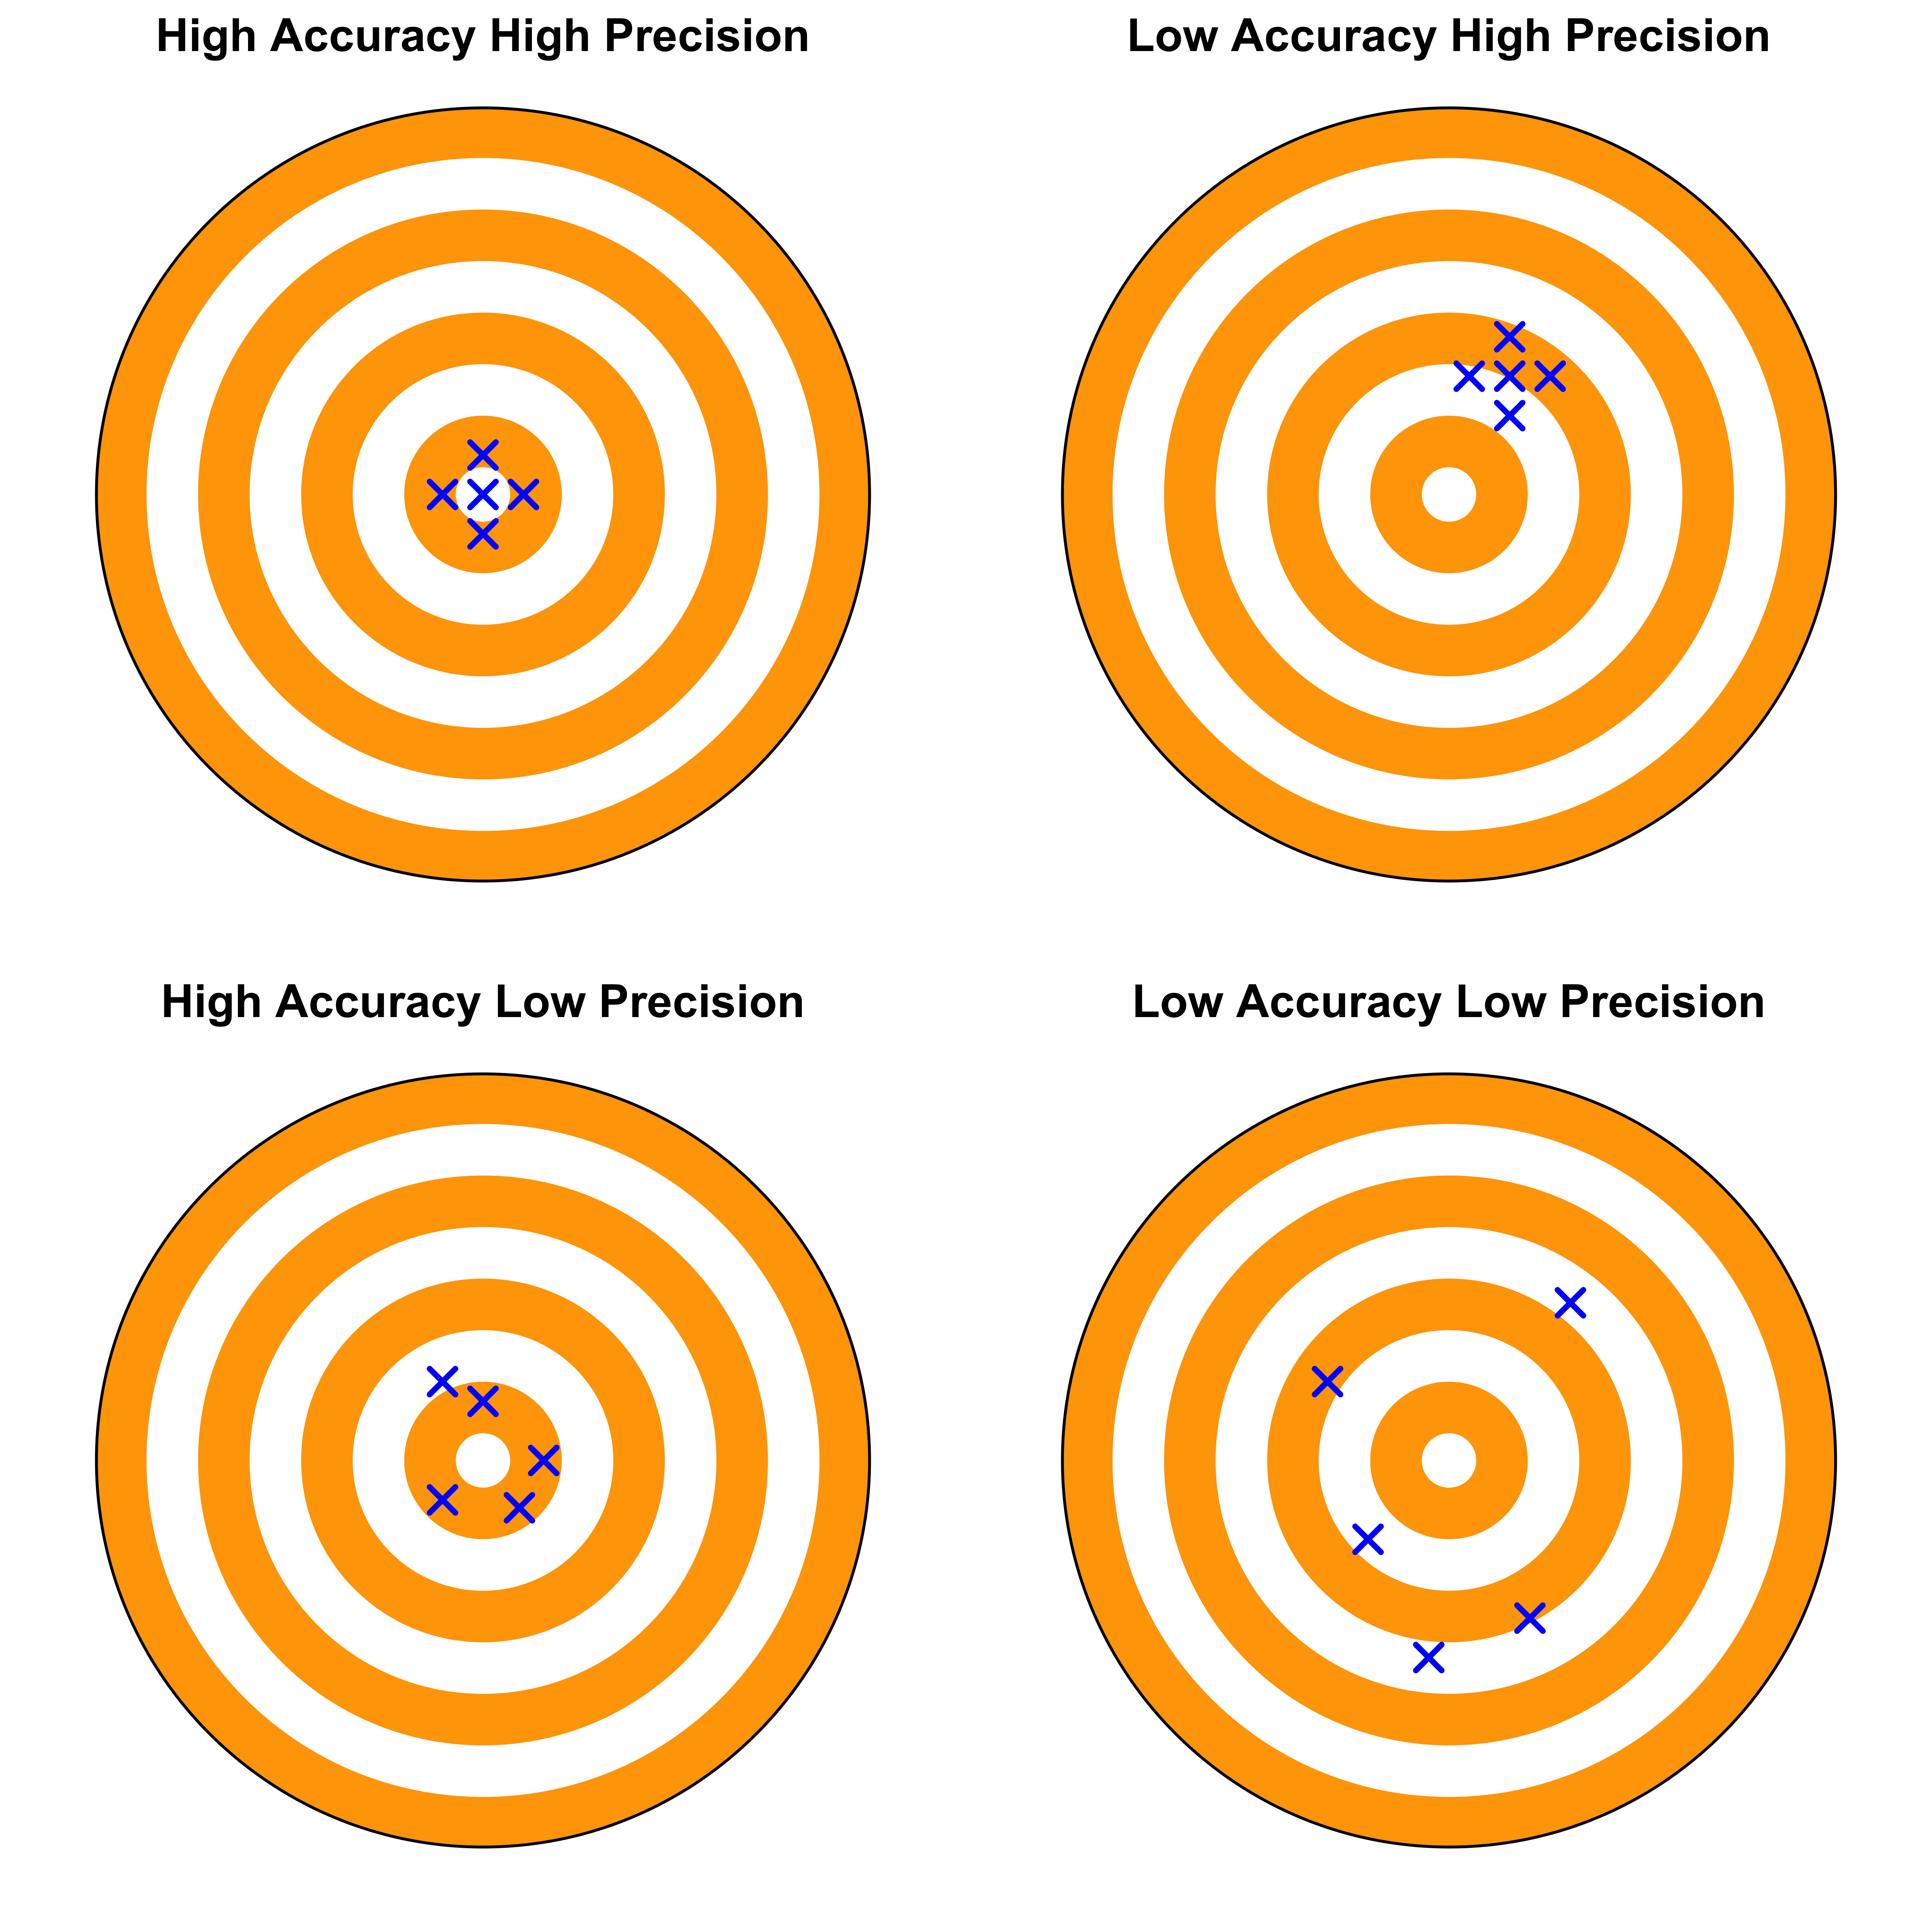
That’s it!
Feel free to reach me out if you got any questions.
Muhammad Mohsin Raza
Data Scientist
My research interests include disease modeling in space and time, climate change, GIS and Remote Sensing and Data Science in Agriculture.